В этой статье мы расскажем об установке и настройке Grafana, как пользоваться этим инструментом, вы узнаете как подключить внешние источники данных и многое другое.
Grafana — инструмент с открытым исходным кодом для визуализации данных из различных систем сбора статистики. Используется для представления в графическом виде временных рядов и текстовых данных.
Grafana поддерживает установку на самые популярные операционные системы: Linux (Debian, Ubuntu, CentOS, Fedora, OpenSuse, RedHat), Mac и Windows. Допустимыми базами данных, в которых возможно хранение данных о пользователях и дашбордах, являются SQLite (используется по умолчанию), MySQL и PostgreSQL. В качестве демонстрационных серверов будем использовать «Облачные серверы» с операционными системами CentOS Stream и Ubuntu, на которые установим Grafana с базой данных SQLite.
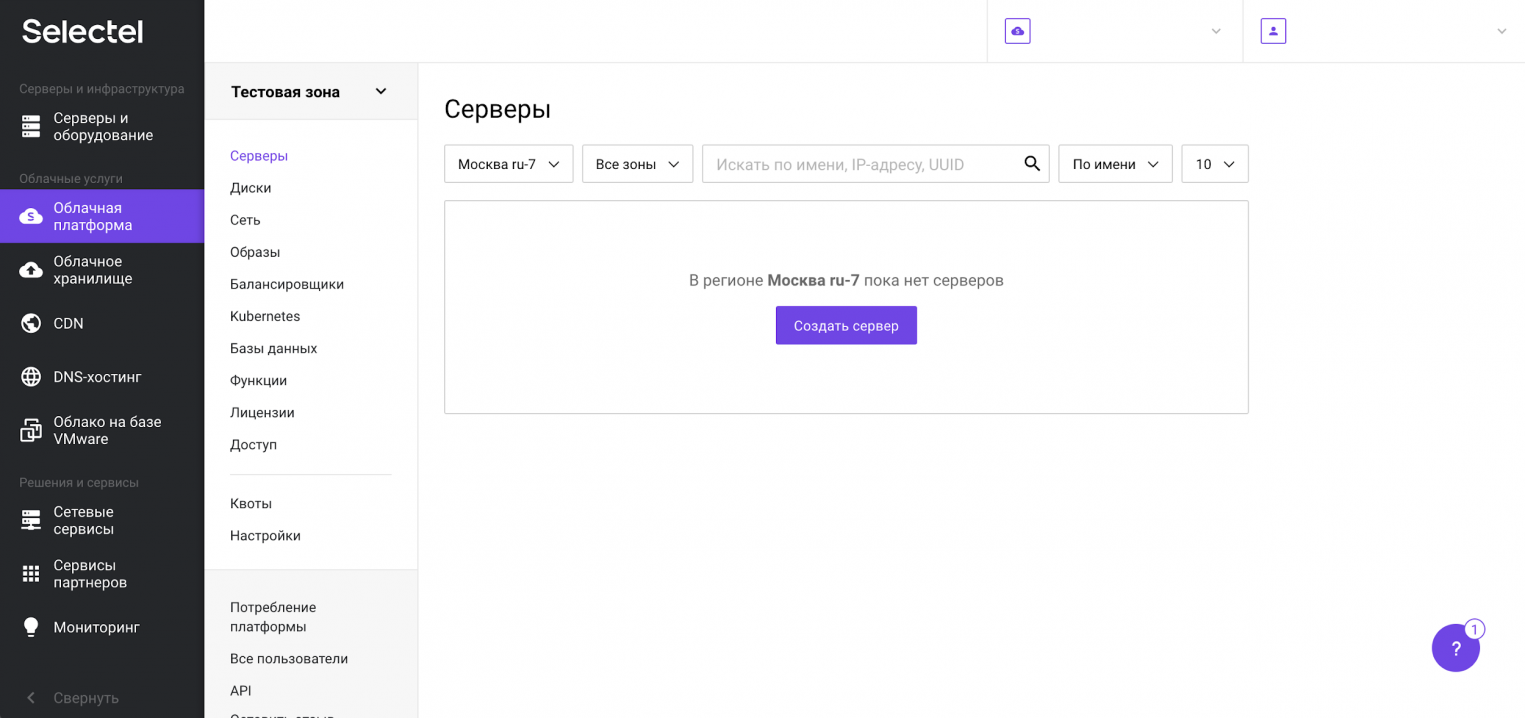
Перед началом установки Grafana, подготовим серверы. В консоли управления Selectel перейдём в раздел Облачная платформа и нажмём кнопку Создать сервер.
На следующем представлении выберем готовую конфигурацию сервера с 1 vCPU и 1 ГБ RAM с операционной системой CentOS 8 64-bit.
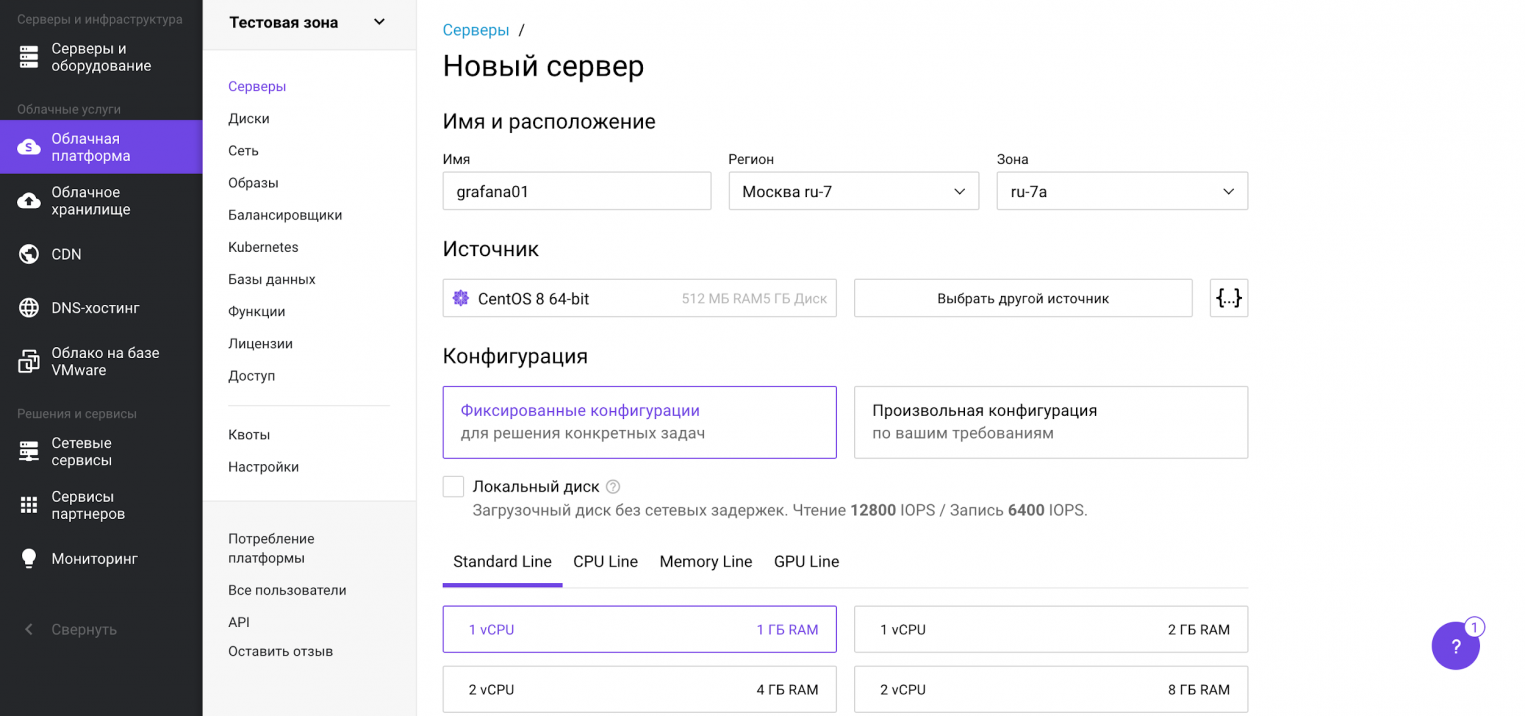
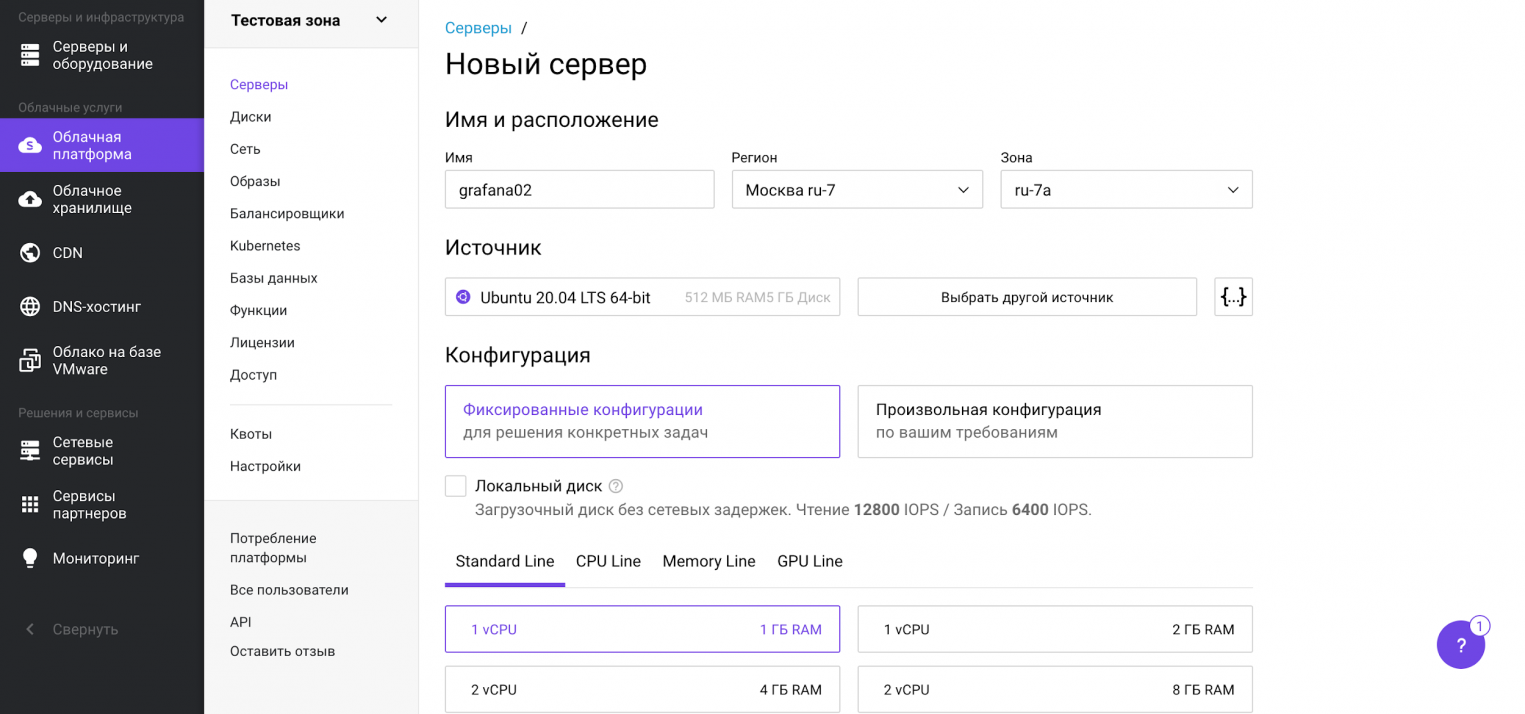
Наш сервер будет иметь 10 ГБ на жестком диске. Для целей демонстрации этого достаточно. Прокручиваем вниз и нажимаем кнопку Создать. Аналогичным образом создадим сервер с Ubuntu 20.04 LTS 64-bit.
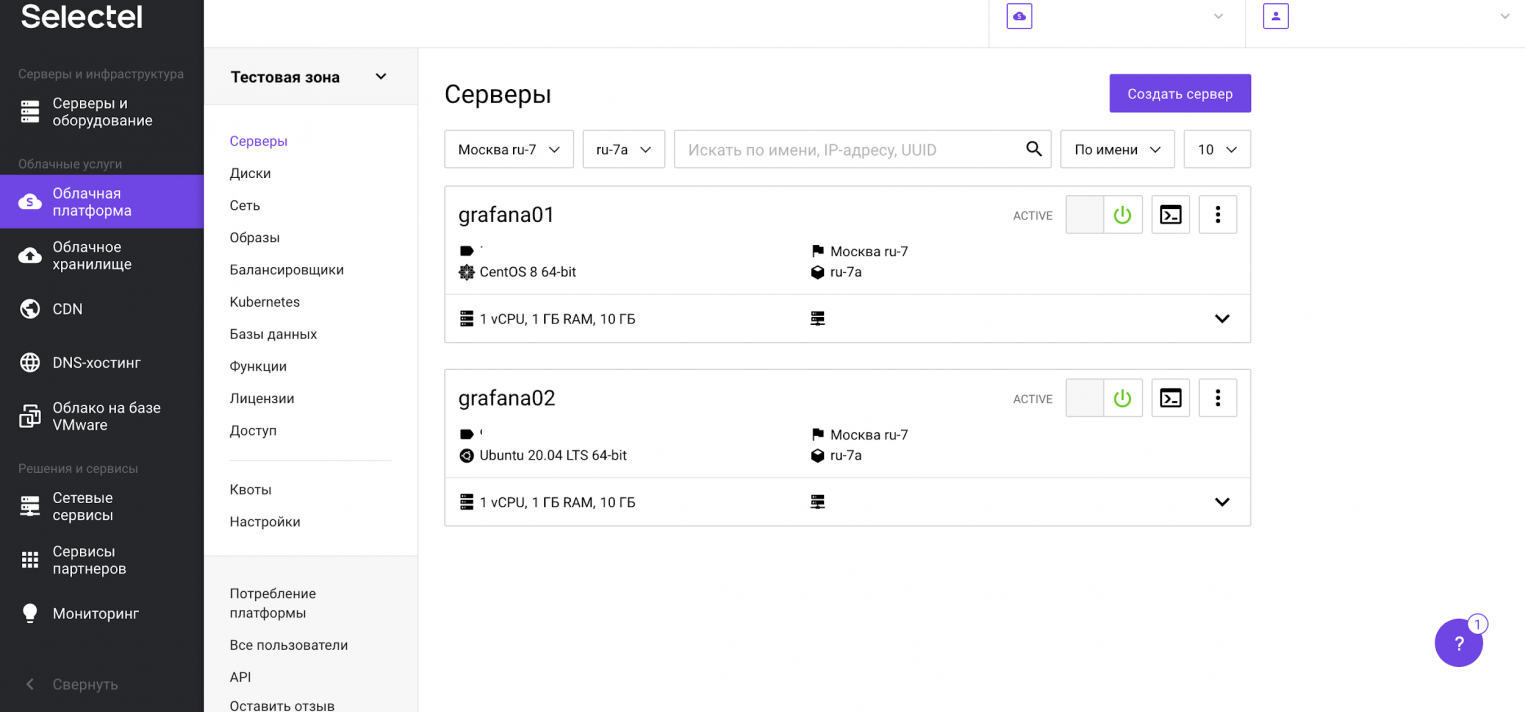
После проделанных манипуляций оба сервера появятся в списке доступных. Приступим к установке Grafana.
Установка Grafana на CentOS Stream
Установка Grafana на CentOS Stream выполняется из репозитория разработчиков. Скачать дистрибутив можно также с официального сайта. Создадим новую конфигурацию репозитория:
sudo nano /etc/yum.repos.d/grafana.repo
Впишем в этот файл следующие переменные со значениями:
[grafana]
name=grafana
baseurl=https://packages.grafana.com/oss/rpm
repo_gpgcheck=1
enabled=1
gpgcheck=1
gpgkey=https://packages.grafana.com/gpg.key
sslverify=1
sslcacert=/etc/pki/tls/certs/ca-bundle.crt
Далее установим Grafana:
sudo yum install grafana -y
После установки включаем автозагрузку и запускаем демон Grafana:
sudo systemctl enable grafana-server
sudo systemctl start grafana-server
Установка завершена. Grafana на CentOS Stream готова к использованию. Проверим текущий статус сервиса:
sudo systemctl status grafana-server
В результате получим вывод:
grafana-server.service - Grafana instance
   Loaded: loaded (/usr/lib/systemd/system/grafana-server.service; enabled; vendor preset: enabled)
   Active: active (running) since Mon 2021-01-25 09:48:04 MSK; 5s ago
Установка Grafana на Ubuntu 20.04
На Ubuntu Grafana устанавливается из репозитория производителя. Скачаем GPG-ключ и добавим его в список надежных:
wget -q -O - https://packages.grafana.com/gpg.key | sudo apt-key add -
После этого добавим в систему репозиторий Grafana:
sudo add-apt-repository "deb https://packages.grafana.com/oss/deb stable main"
Далее обновляем кэш APT и установим Grafana:
sudo apt update
sudo apt install grafana
После установки включаем автозагрузку и запускаем демон Grafana:
sudo systemctl enable grafana-server
sudo systemctl start grafana-server
Установка завершена. Grafana на Ubuntu 20.04 готова к использованию. Проверим текущий статус сервиса:
sudo systemctl status grafana-server
В результате получим вывод:
grafana-server.service - Grafana instance
   Loaded: loaded (/usr/lib/systemd/system/grafana-server.service; enabled; vendor preset: enabled)
   Active: active (running) since Mon 2021-01-25 09:44:26 MSK; 10s ago
Настройка брандмауэра для доступа к Grafana
По умолчанию Grafana доступна на порту 3000. При использовании firewalld или iptables, необходимо разрешить сетевой доступ к этому порту из внешнего мира.
Набор команд для firewalld (добавление нового правила и перезагрузка сервиса firewalld для применения конфигурации):
firewall-cmd --zone=public --add-port=3000/tcp --permanent
systemctl reload firewalld
Набор команд для iptables:
nano /etc/sysconfig/iptables
Вписываем в раздел OUTPUT ACCEPT следующую строку:
-A INPUT -p tcp -m tcp --dport 3000 -m state --state NEW -j ACCEPT
И перезапускаем iptables:
sudo systemctl restart iptables
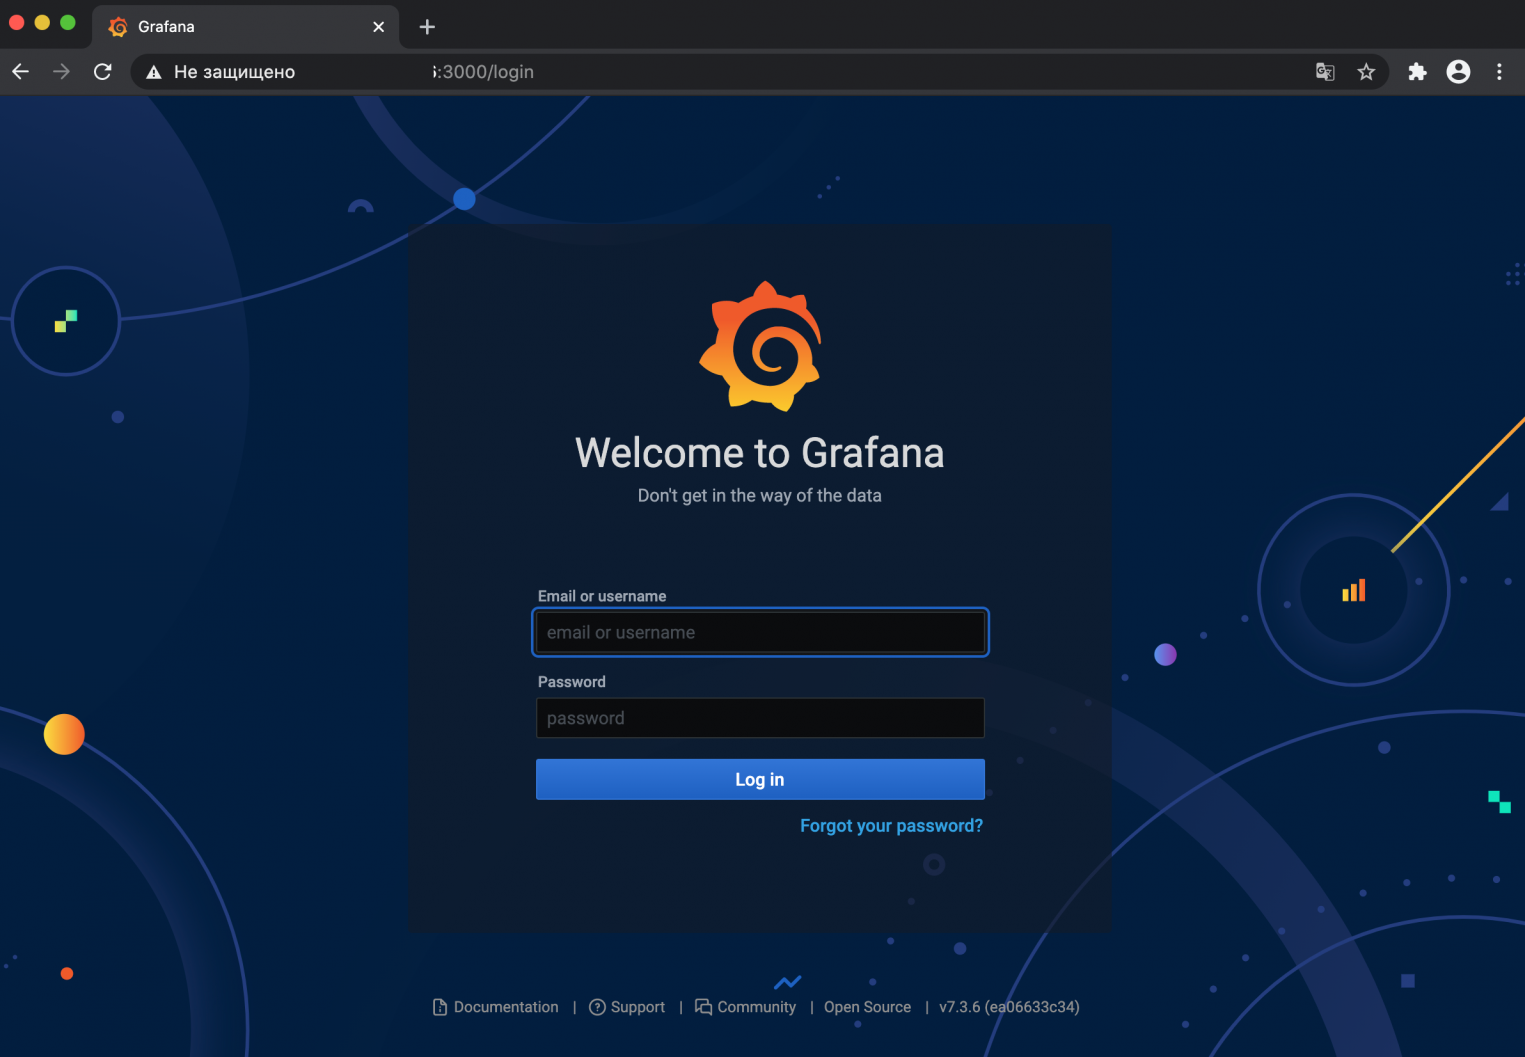
После выполнения описанных в этом разделе манипуляций, сетевой экран будет разрешать подключения по порту 3000. В этом можно убедиться, открыв в браузере интерфейс Grafana. Логин и пароль по умолчанию admin.
Если не удается войти в Grafana или вы поменяли пароль и не можете его вспомнить, через CLI административный пароль Web-интерфейса можно сбросить:
grafana-cli admin reset-admin-password --homepath "/usr/share/grafana" новый_пароль
После выполнения команды выше, можно входить с новым паролем.
Источники данных Grafana и установка плагинов
Grafana поддерживает из коробки различные источники данных:
- Prometheus,
- Graphite,
- OpenTSDB,
- InfluxDB,
- Elasticsearch и другие.
Полный список можно посмотреть в документации. Перечень встроенных источников данных может быть расширен при помощи сторонних плагинов. Один из таких плагинов — плагин Zabbix для Grafana. Мониторинг — одно из основных назначений использования Grafana.
Установим этот плагин и добавим его в Grafana.
grafana-cli plugins install alexanderzobnin-zabbix-app
Теперь перезагрузим сервис Grafana:
systemctl restart grafana-server
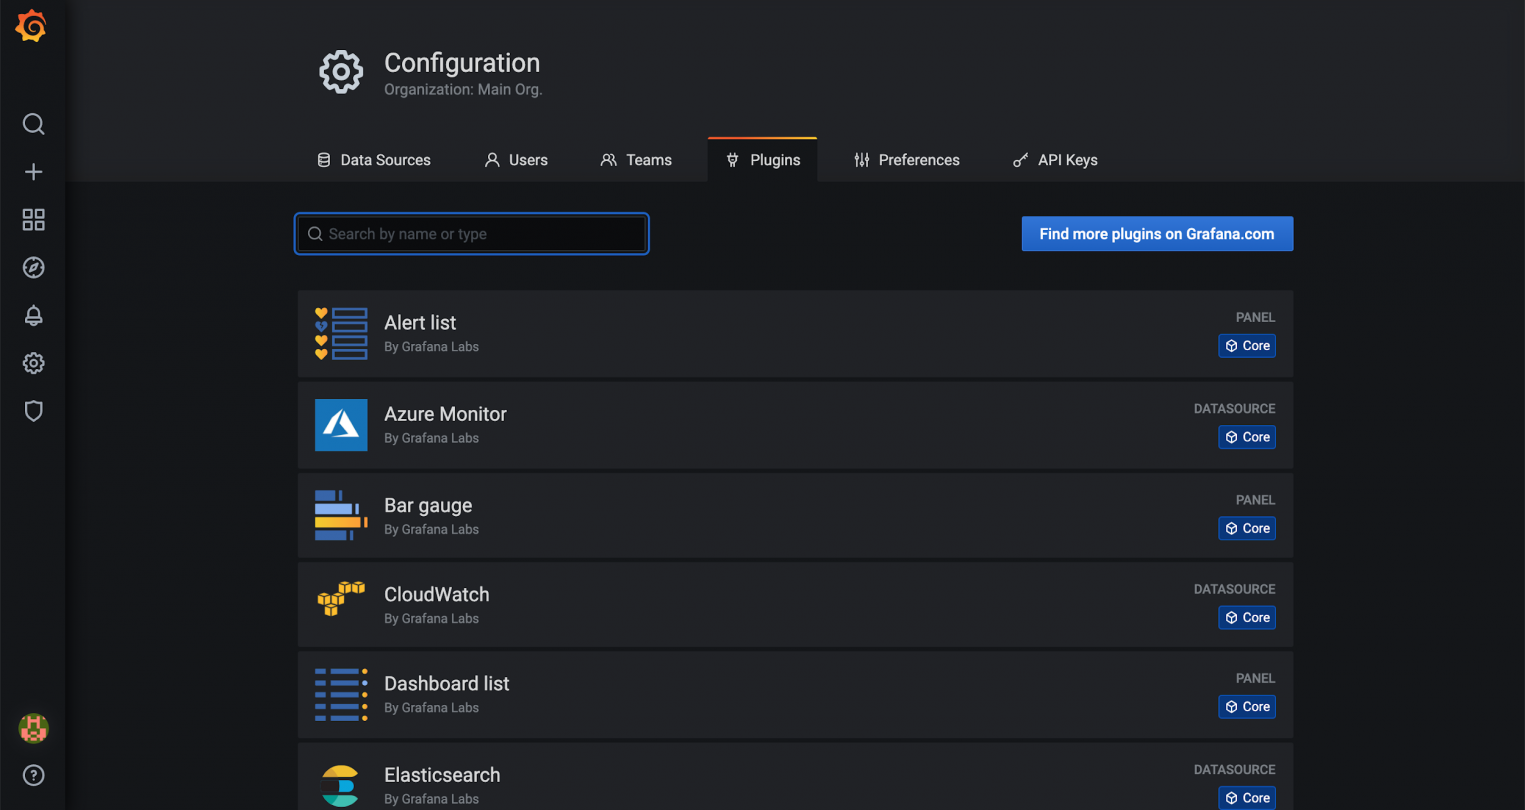
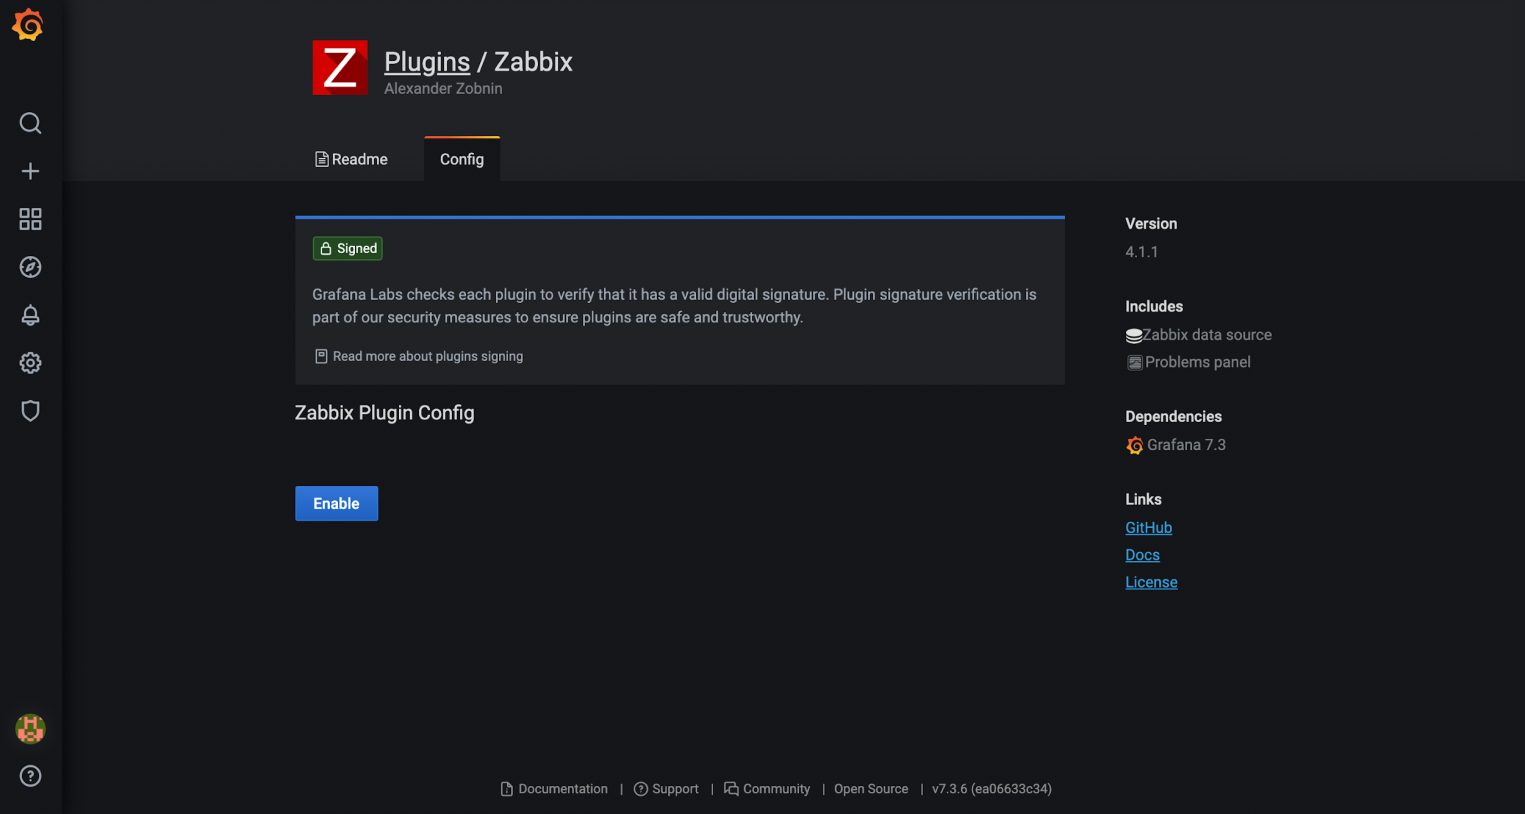
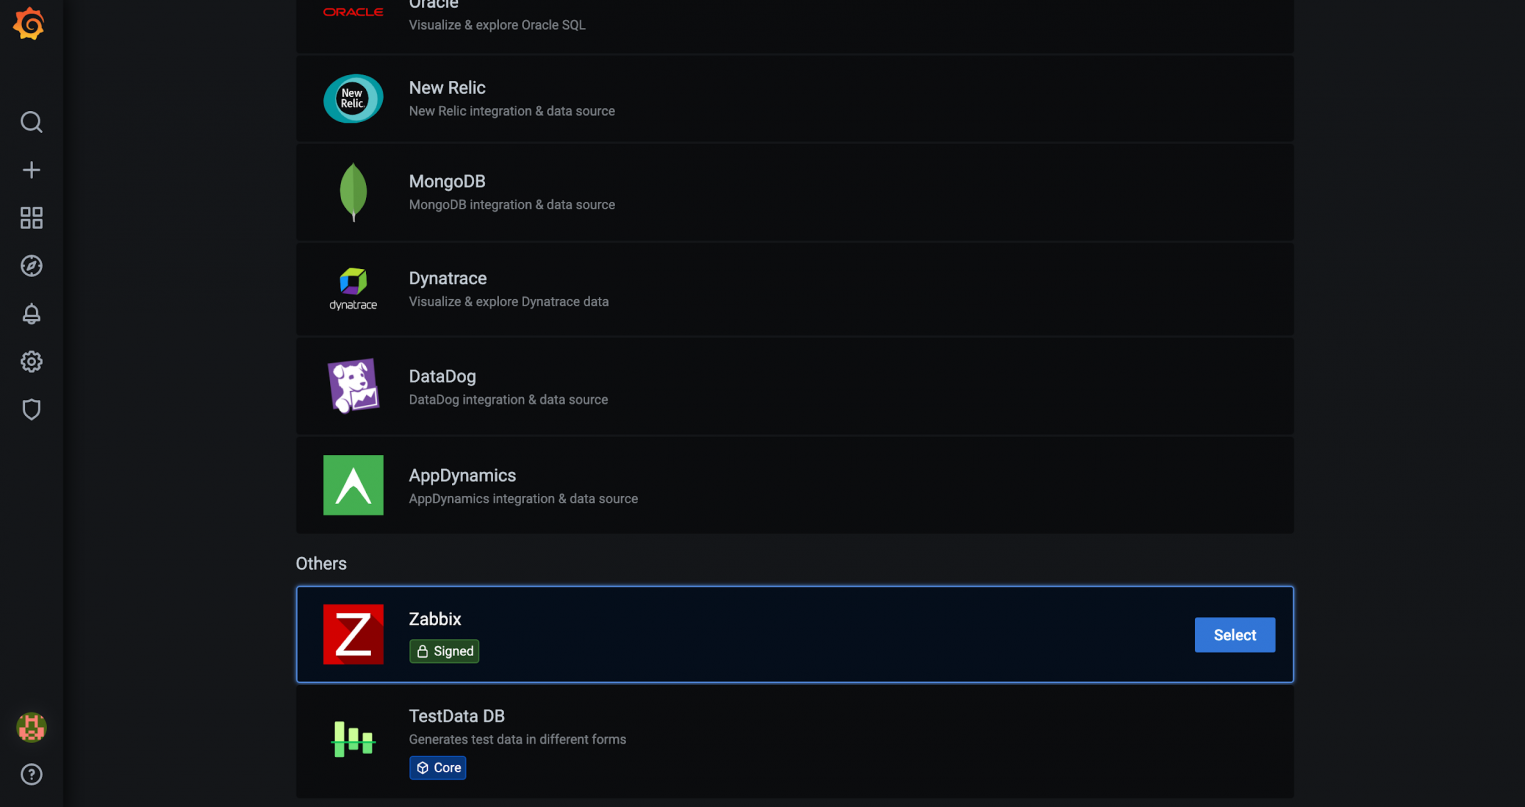
В интерфейсе Grafana перейдём в Configuration -> Plugins и обнаружим здесь плагин для Zabbix.
Перейдем к настройке плагина и нажмём на кнопку Enable.
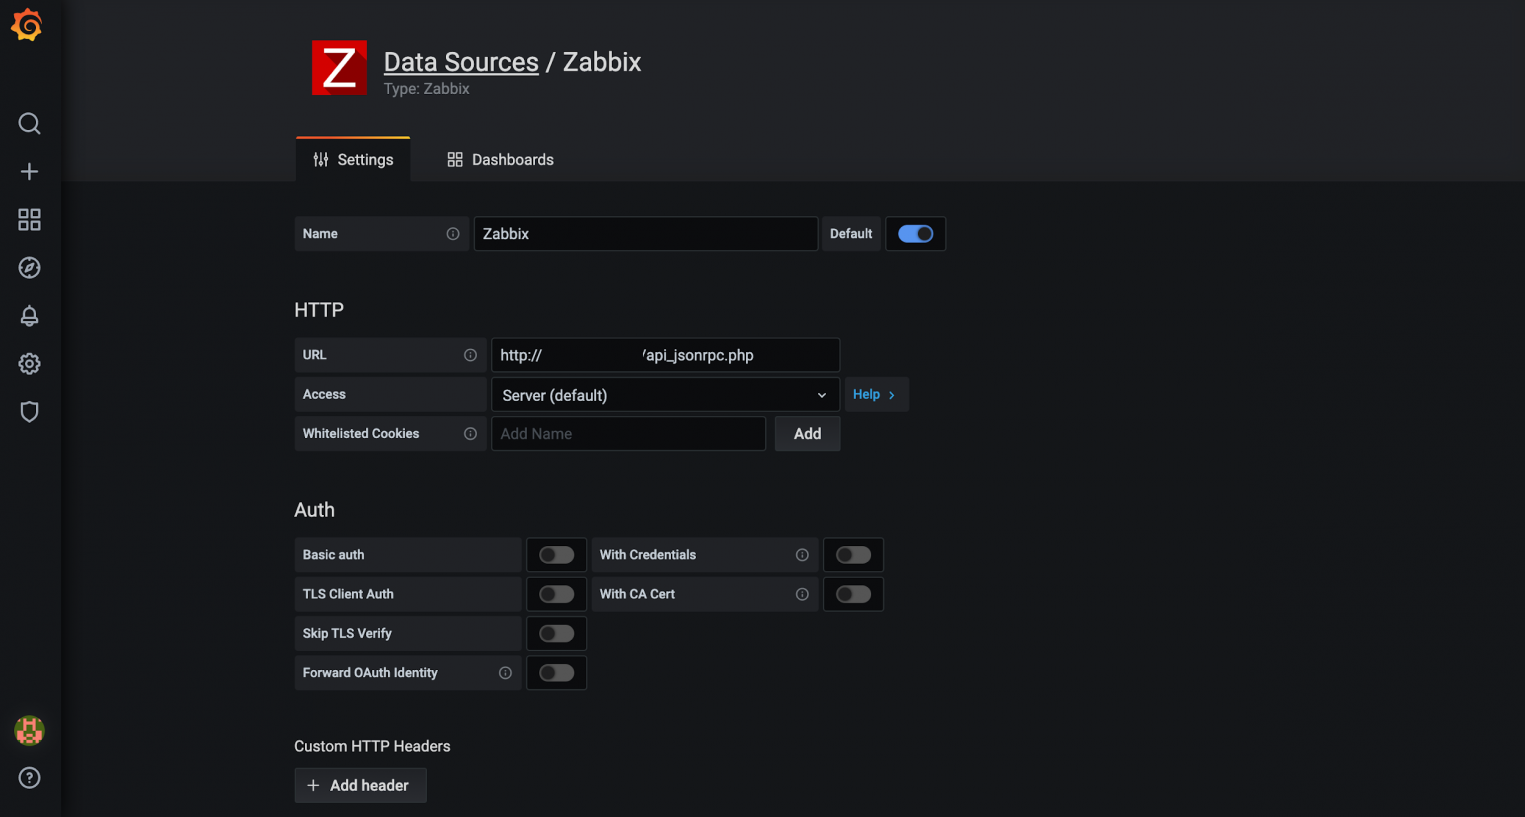
С момента включения плагина, в меню Data Sources появится новый источник данных — Zabbix. Нажмём на кнопку Select и настроим источник данных.
В настройках плагина укажем URL-адрес, имя пользователя и пароль для доступа по API к Zabbix.
Нажимаем на кнопку Save & Test и получаем подтверждение корректности настроек.
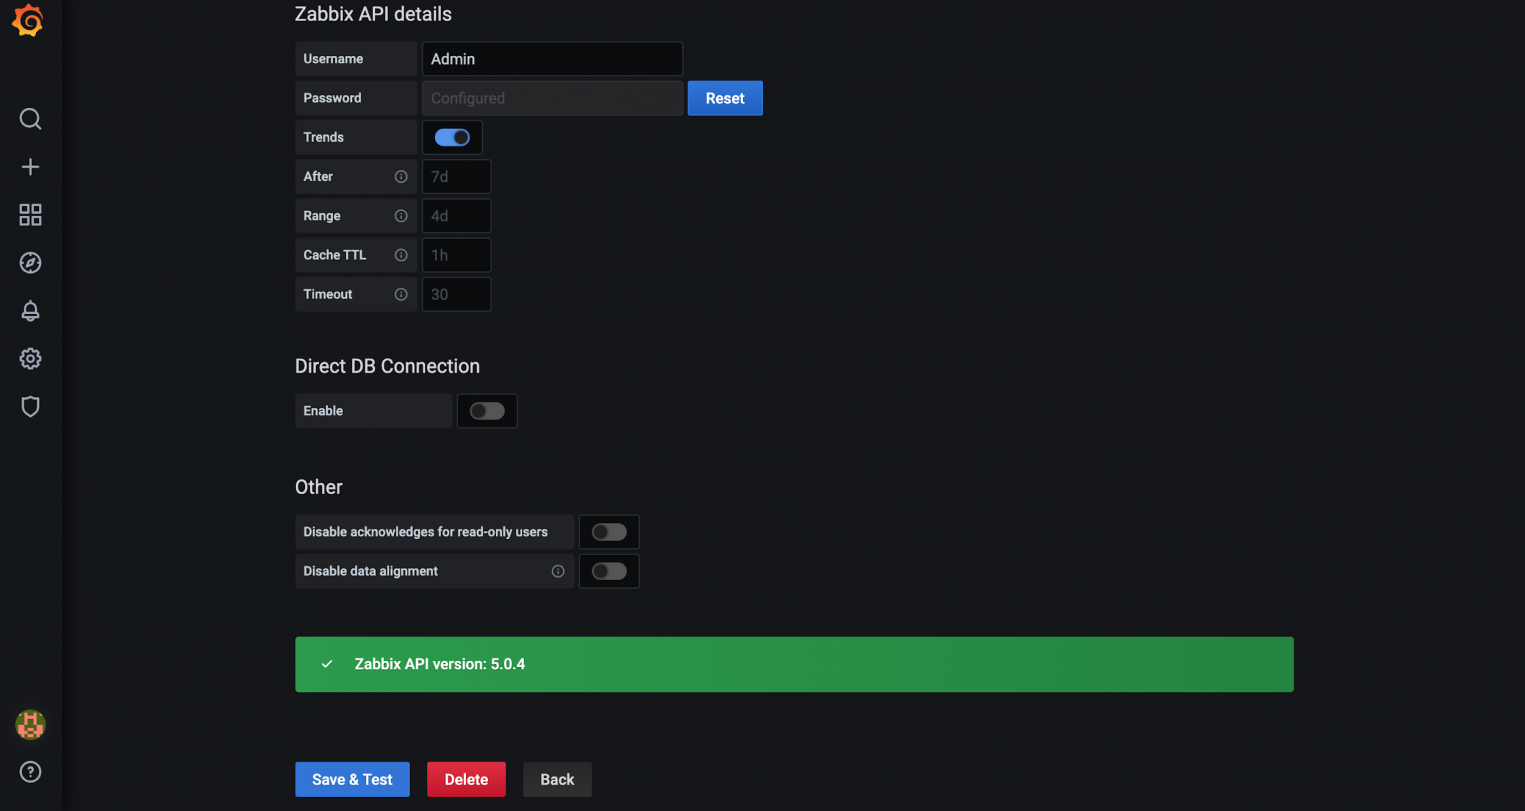
С этого момента данных из Zabbix могут быть использованы для создания визуализаций.
Создание и настройка панелей и дашбордов
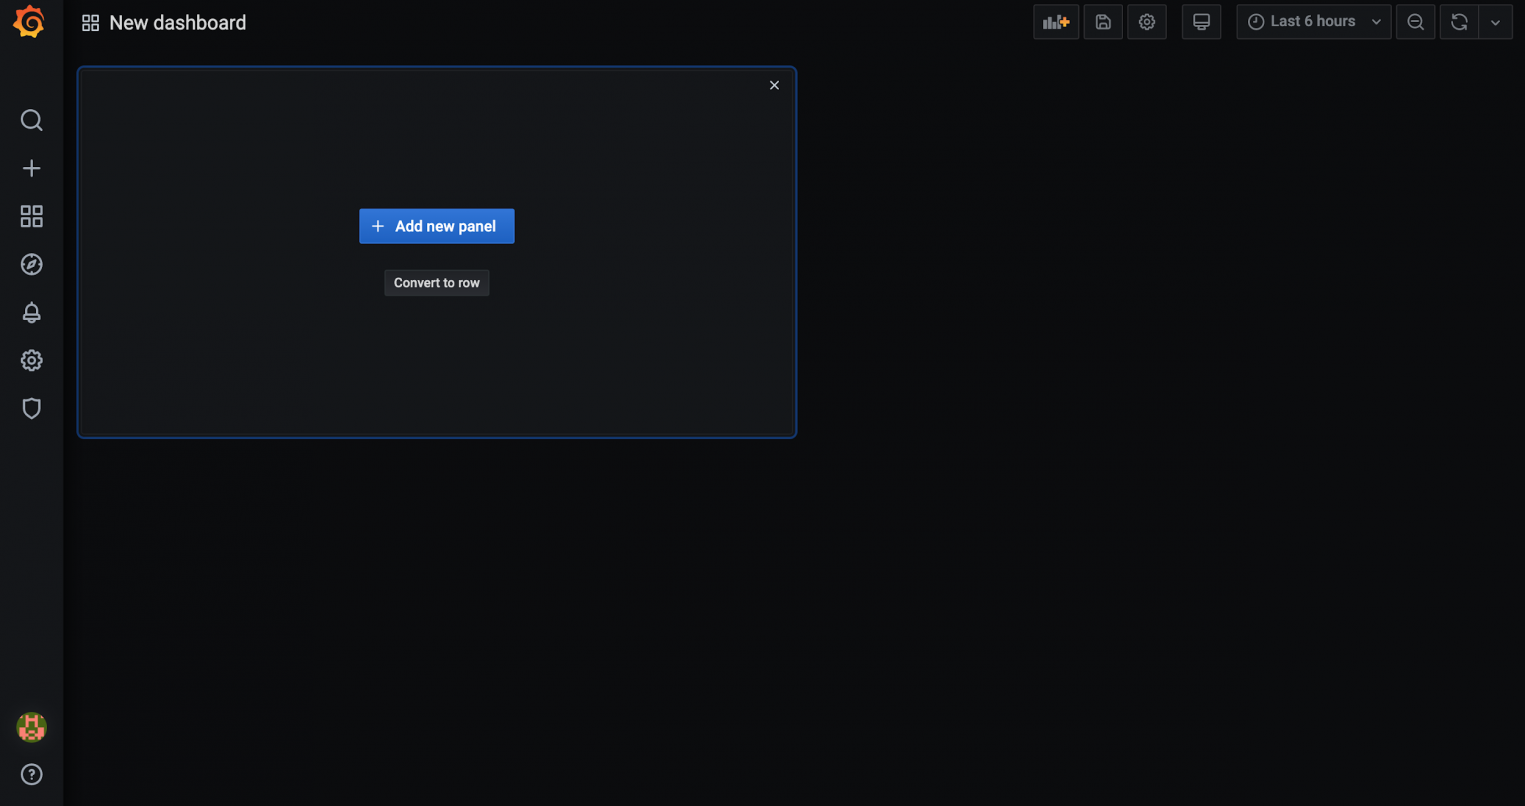
Панели и дашборды — основные сущности представлений внутри Grafana. Каждый дашборд состоит из набора панелей. Для создания дашбордов перейдём в представление Dashboards и нажмём на кнопку New Dashboard.

На следующем шаге будет предложено добавить на дашборд новую панель.
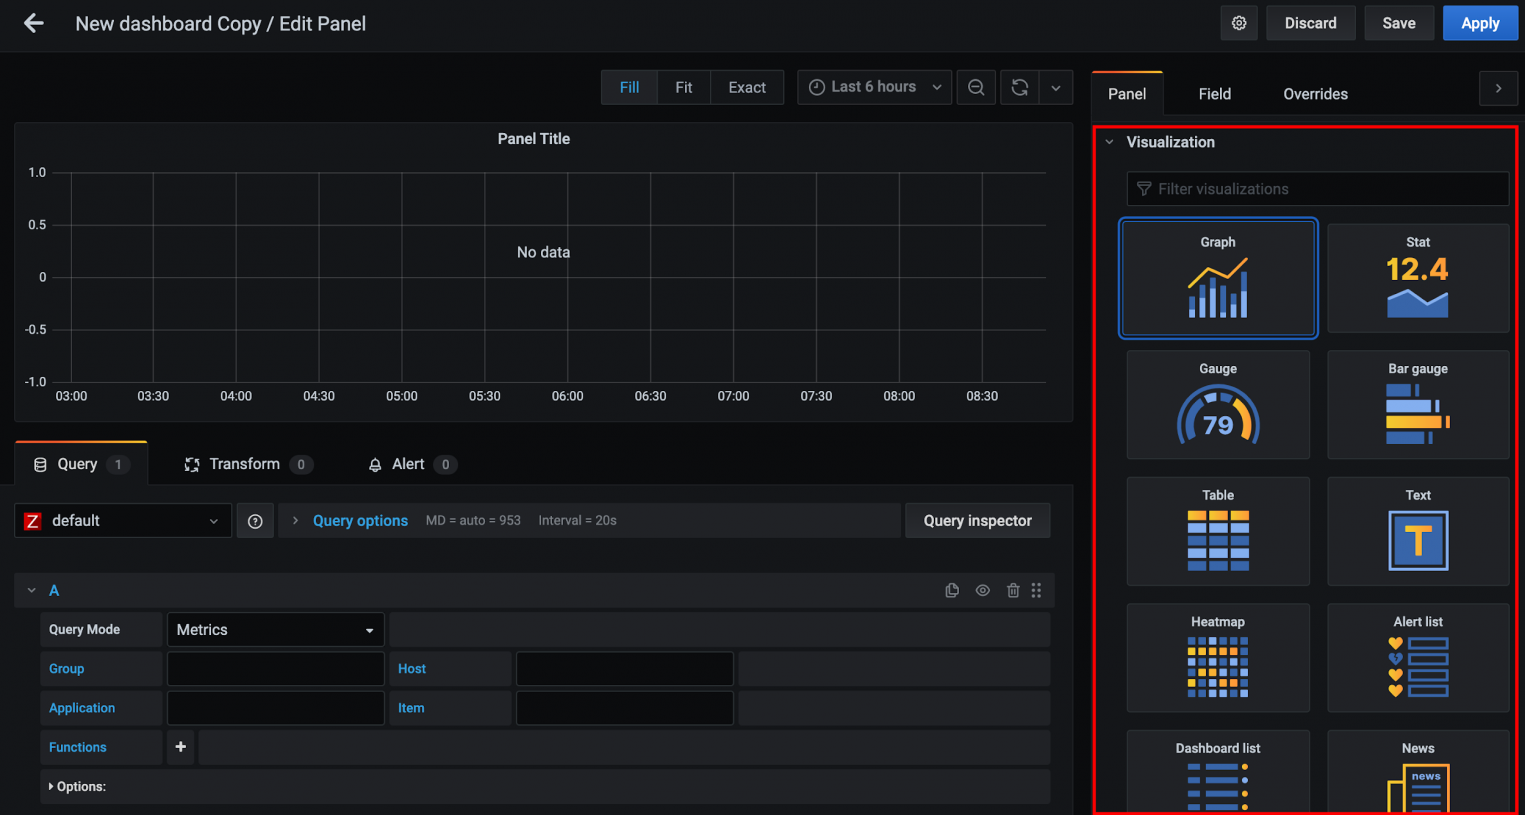
Grafana имеет встроенные панели, которые можно сразу начинать использовать. По умолчанию представлены следующие типы:
- Graph — панель с графиками с возможностью комбинировать несколько метрик на одной панели.
- Stat (ранее SingleStat) — панель с одиночным графиком и возможностью отображения моментального значения метрики.
- Gauge — панель в формате спидометра, есть возможность ограничить верхнее значение на шкале.
- Bar Gauge — панель с возможностью отображения нескольких метрик на вертикальной гистограмме.
- Table — панель с представлением в виде таблицы, на которой можно отображать значения нескольких метрик.
- Text — панель для отображения произвольного текста (подписи).
- Heatmap — панель для отображения тепловой карты значений метрик.
- Alert list — панель для отображения событий из внешних систем.
- Dashboard list — комбинированная панель для отображения дашбордов, добавленных в избранное.
- News — панель для отображения новостной ленты из внешних источников.
- Zabbix problems — панель для отображения событий из системы мониторинга Zabbix.
- Logs — панель для отображения строчек лога, которые собираются одной из внешних систем.
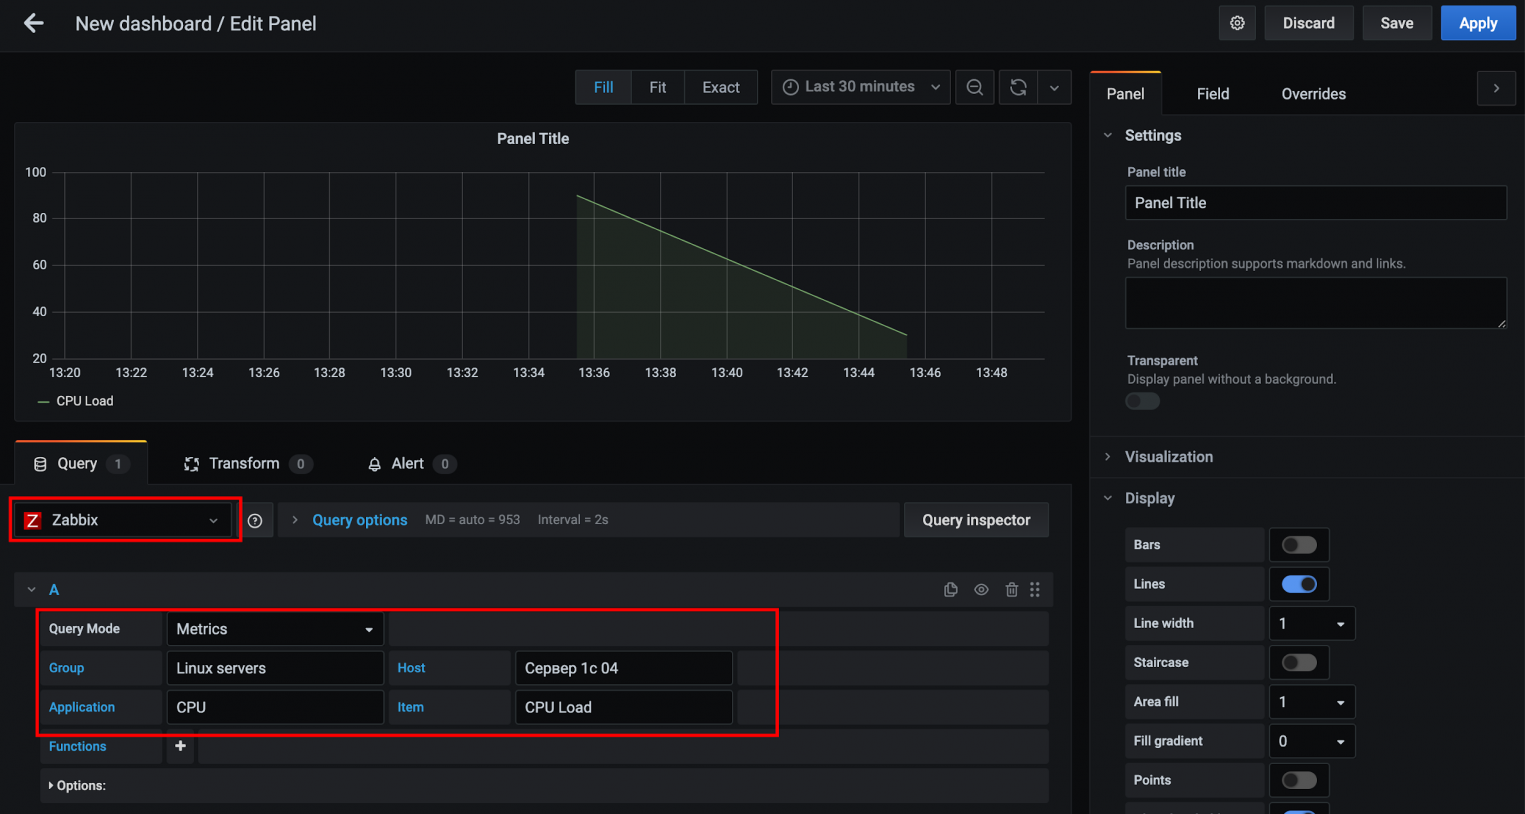
Далее выберем в выпадающем меню источник данных Zabbix и укажем группу, хост, приложение и элемент данных. Если всё выполнено правильно — на графике появятся данные.
Grafana поддерживает различные типы визуализаций:
- графические,
- табличные,
- гистограммы,
- тепловые карты,
- карты сетевого взаимодействия в Grafana и другие.
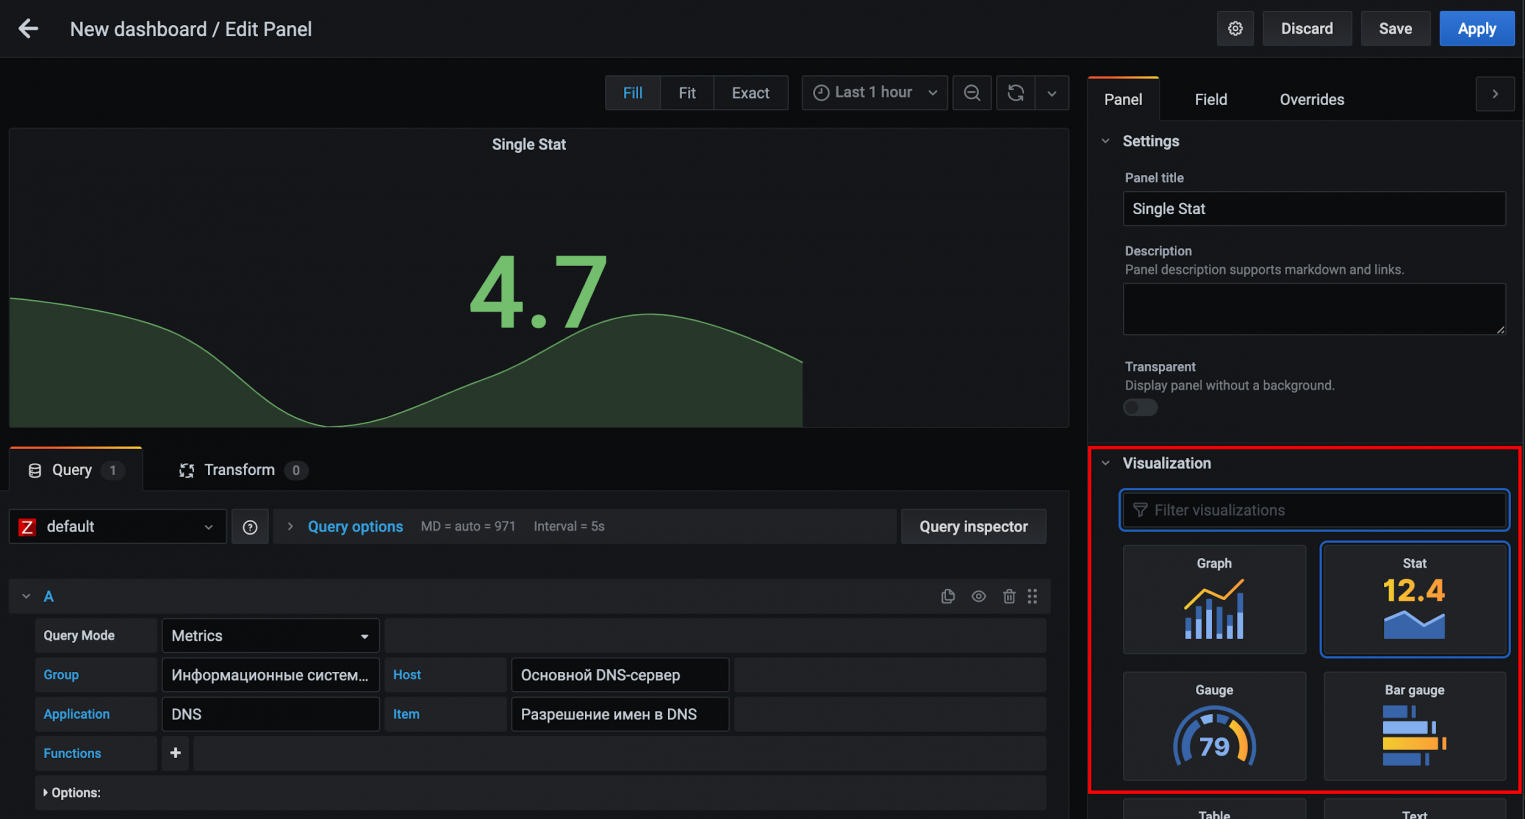
При создании новой панели, в правой части экрана в разделе Visualization есть возможность выбрать тип визуализации. Перейдем к созданию SingleStat (отображается как Stat) — панели с комбинацией численного и графического представлений. После ввода специфических данных для Zabbix, нажмём кнопку Apply.
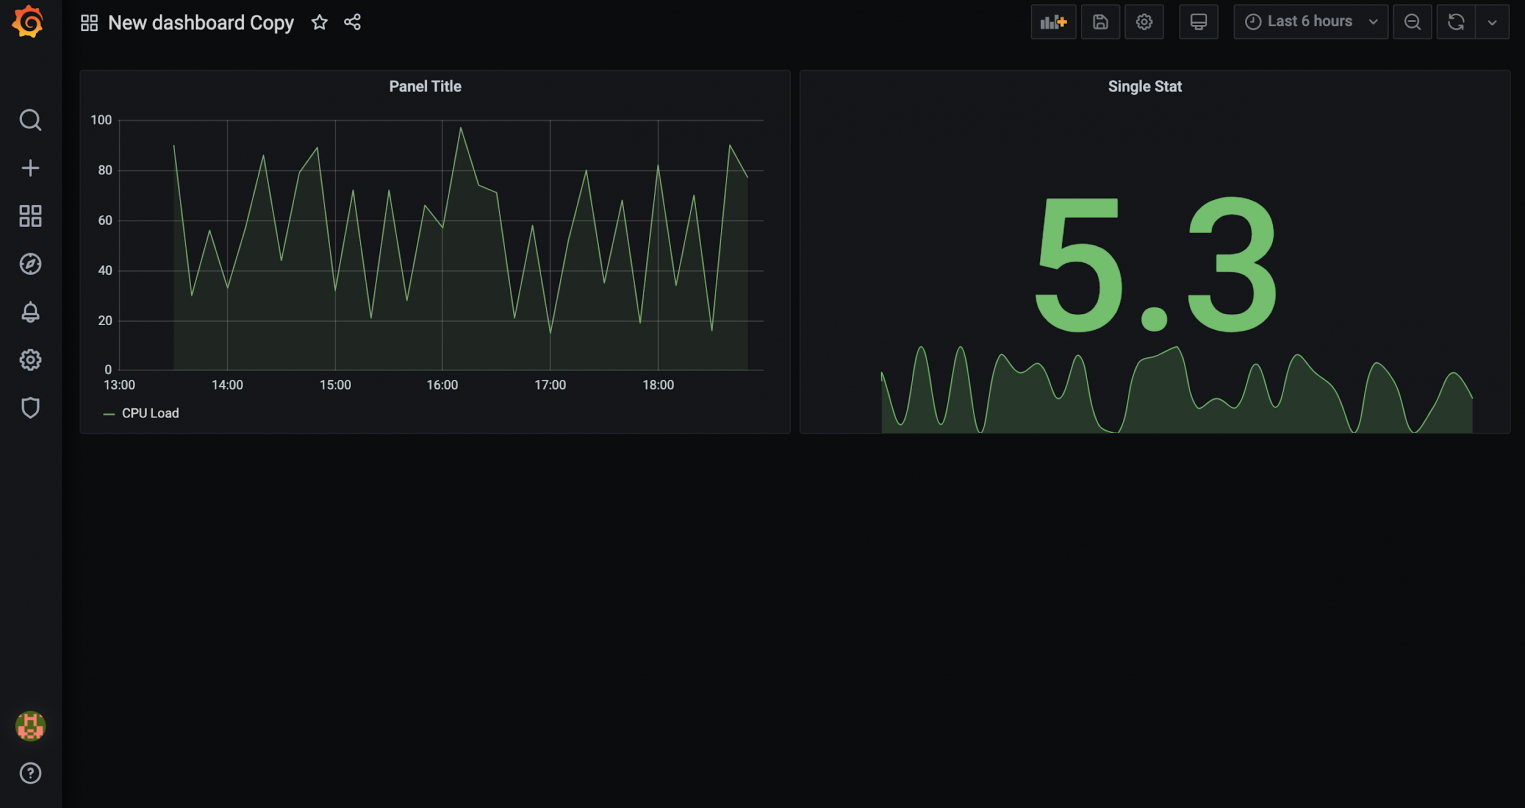
В результате выполненных действий, увидим на дашборде две панели.
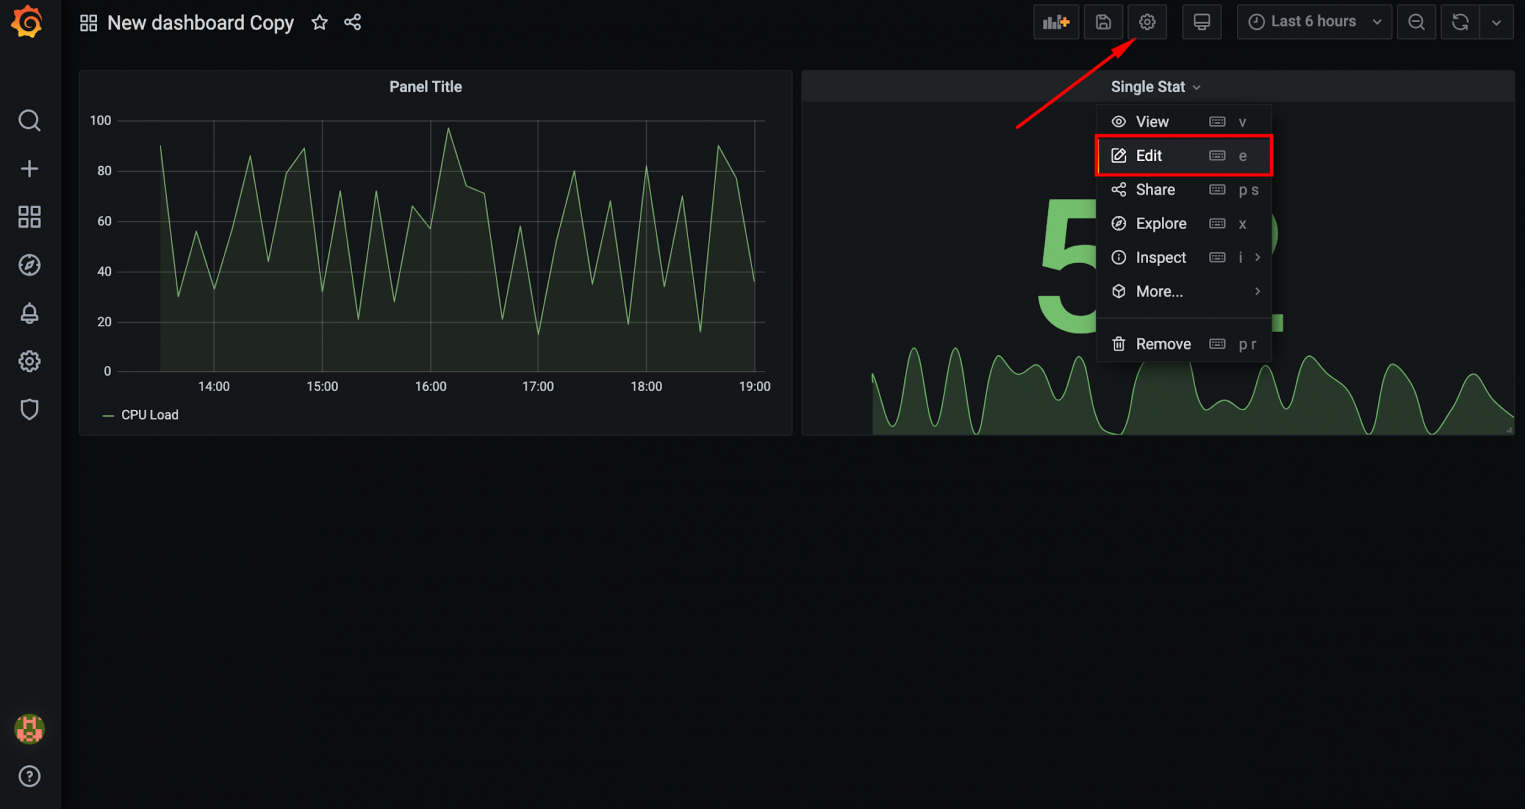
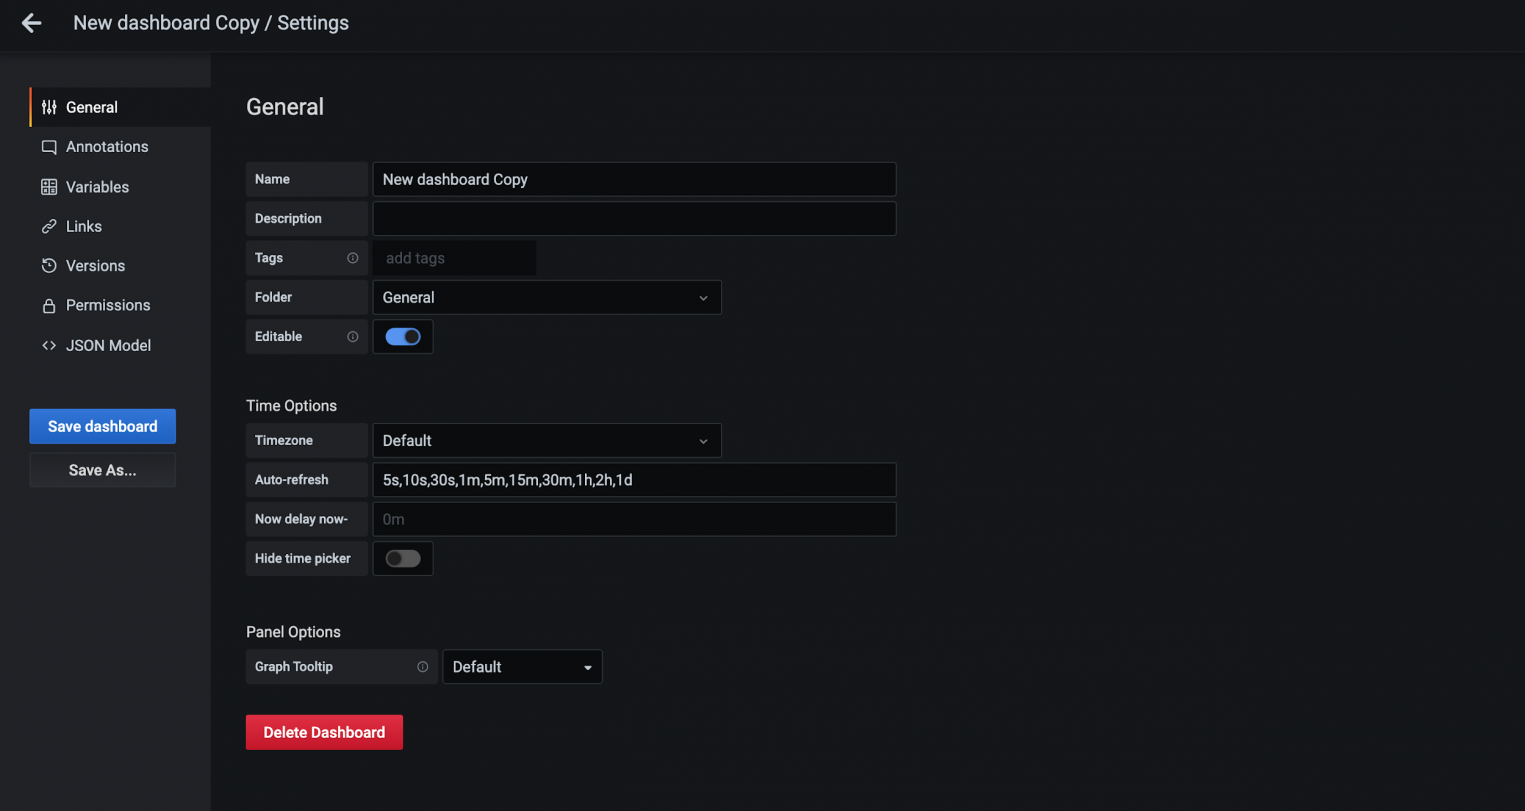
У каждой панели и каждого дашборда в Grafana есть свой набор настроек. Настройки первой открываются через выпадающее меню панели, а настройки второго откроются после нажатия на шестеренку в верхнем правом углу экрана.
На изображении ниже показаны настройки дашборда.
Импорт и экспорт дашбордов
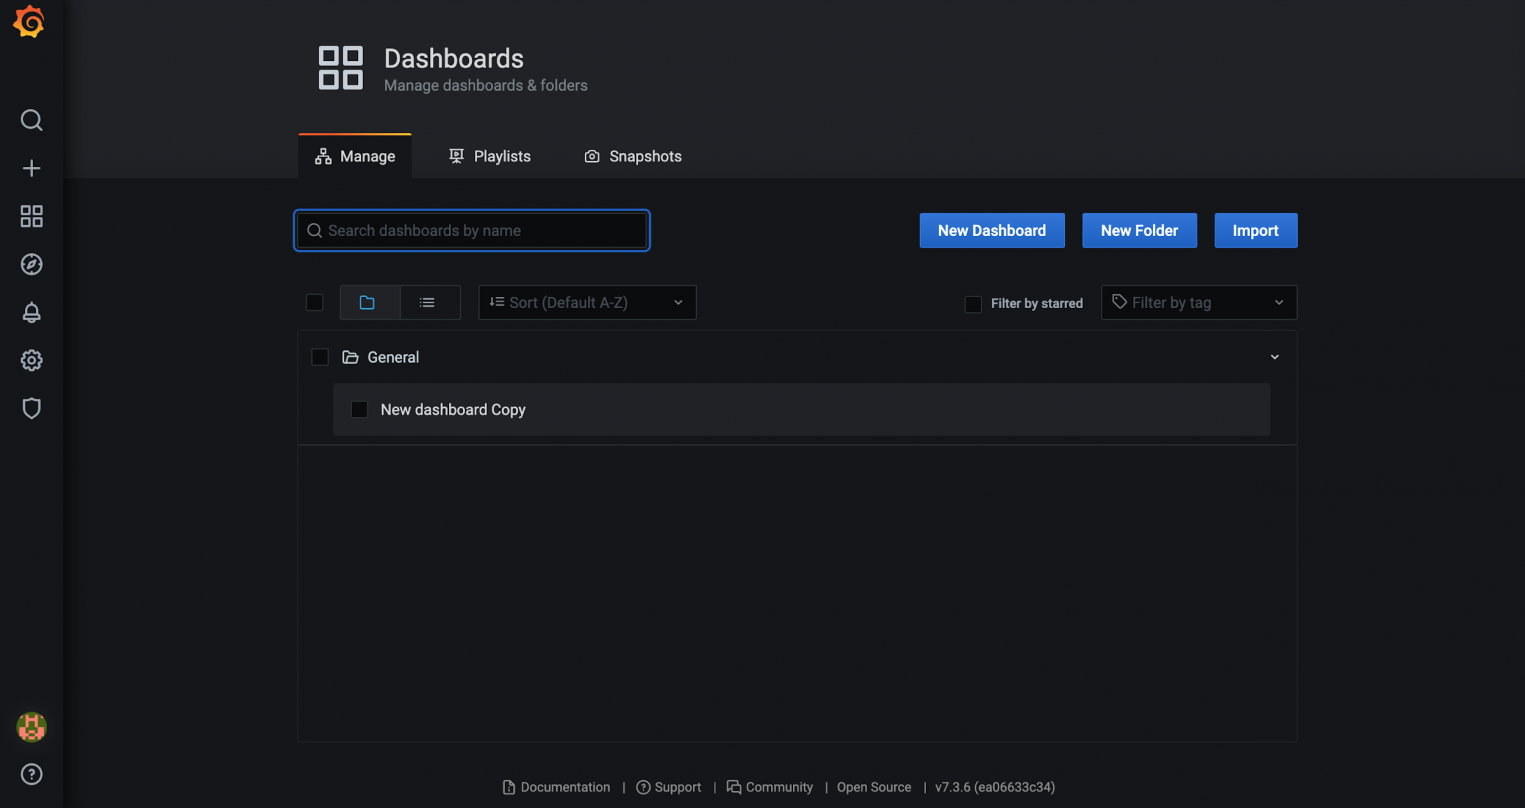
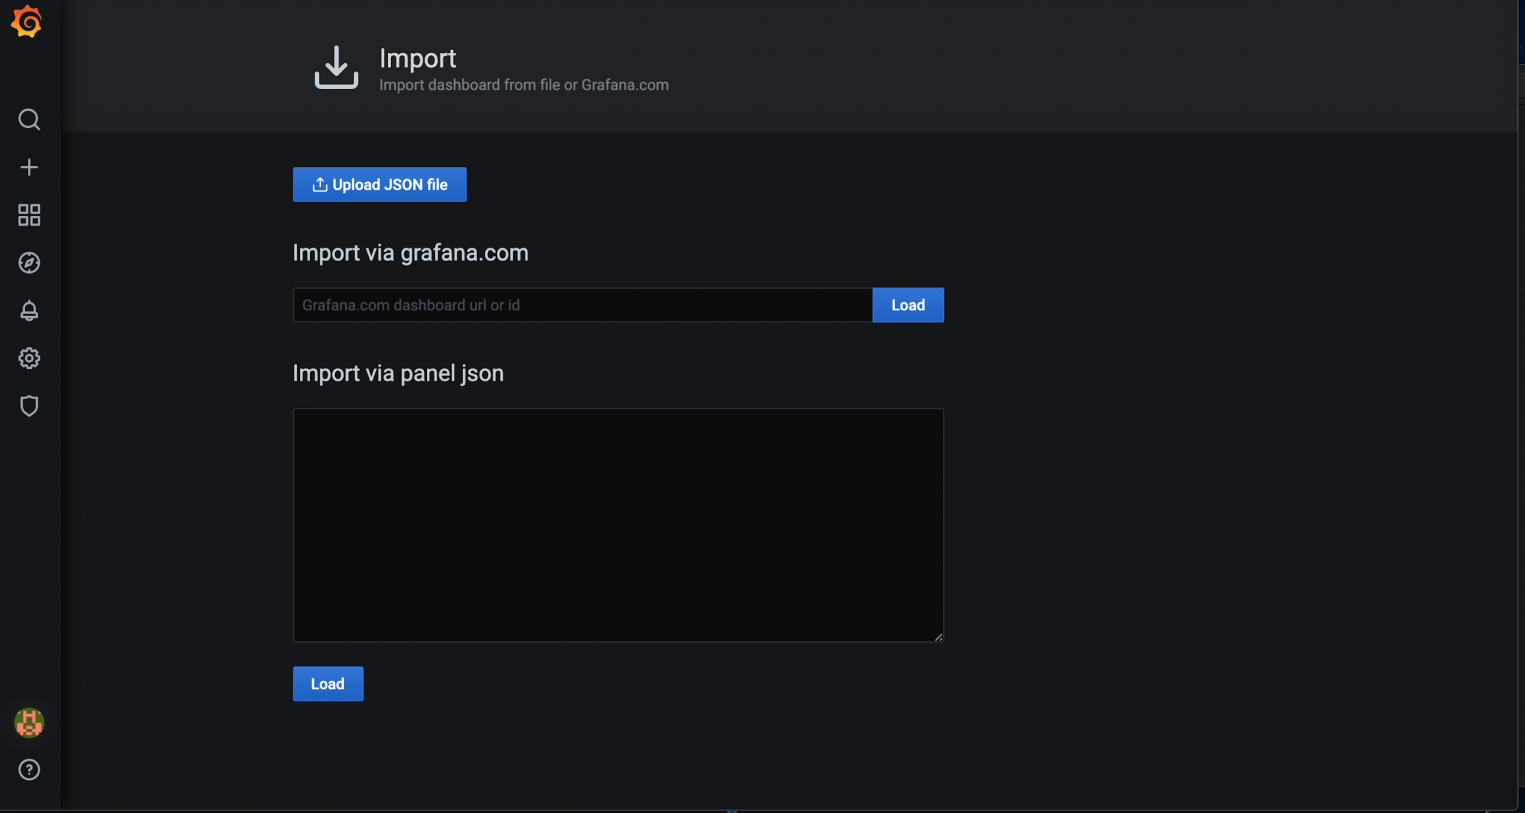
В Grafana можно импортировать и экспортировать дашборды. Для импорта нужно перейти в представление Dashboards и нажать кнопку Import.
Для импорта доступны две опции: загрузка произвольного JSON и импорт готовых дашбордов с grafana.com. Во втором случае нужно указывать ID дашборда.
Для экспорта любого дашборда, необходимо нажать на специальную иконку в верхней части экрана и далее нажать Save to file. Дашборд будет сохранен в формате JSON.
Обратный прокси-сервер и SSL
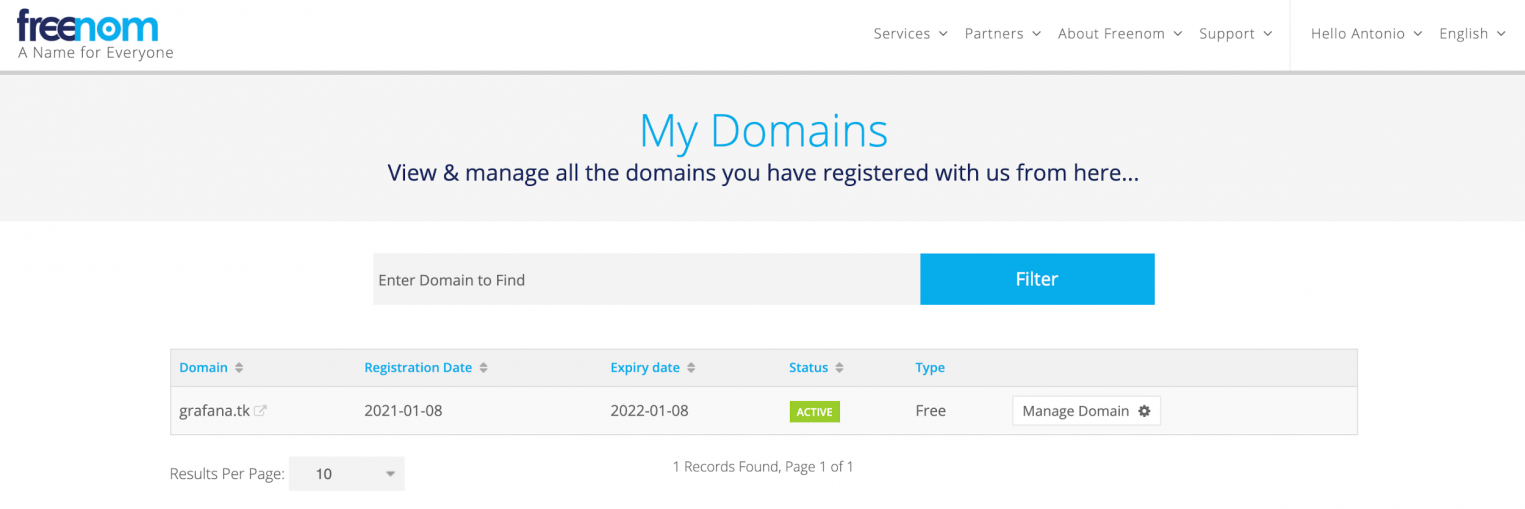
Для настройки SSL в Grafana необходимо использовать обратный прокси-сервер. В этом разделе мы расскажем как настроить такой прокси на базе Nginx. Для целей демонстрации мы зарегистрировали домен grafana.tk, для которого выпустили специальный сертификат Let’s Encrypt.
После создания сервера мы настроили веб-сервер Nginx для работы через SSL. Осталось перенаправить трафик с него на порт 3000, по которому доступна Grafana. Для этого откроем конфигурационный файл веб-сервера.
sudo nano /etc/nginx/sites-available/grafana.tk
В этом файле будем работать с этим блоком конфигурации:
...
        location / {
                try_files $uri $uri/ =404;
        }
...
Заменим его на следующий:
...
    location / {
        proxy_pass http://127.0.0.1:3000;
    }
...
Таким образом мы настроили переадресацию на локальный порт 3000. Теперь можно проверить корректность конфигурации Nginx:
sudo nginx -t
Осталось перезапустить Nginx:
sudo systemctl reload nginx
Теперь наша тестовая Grafana доступна по URL https://grafana.tk. Проверим:
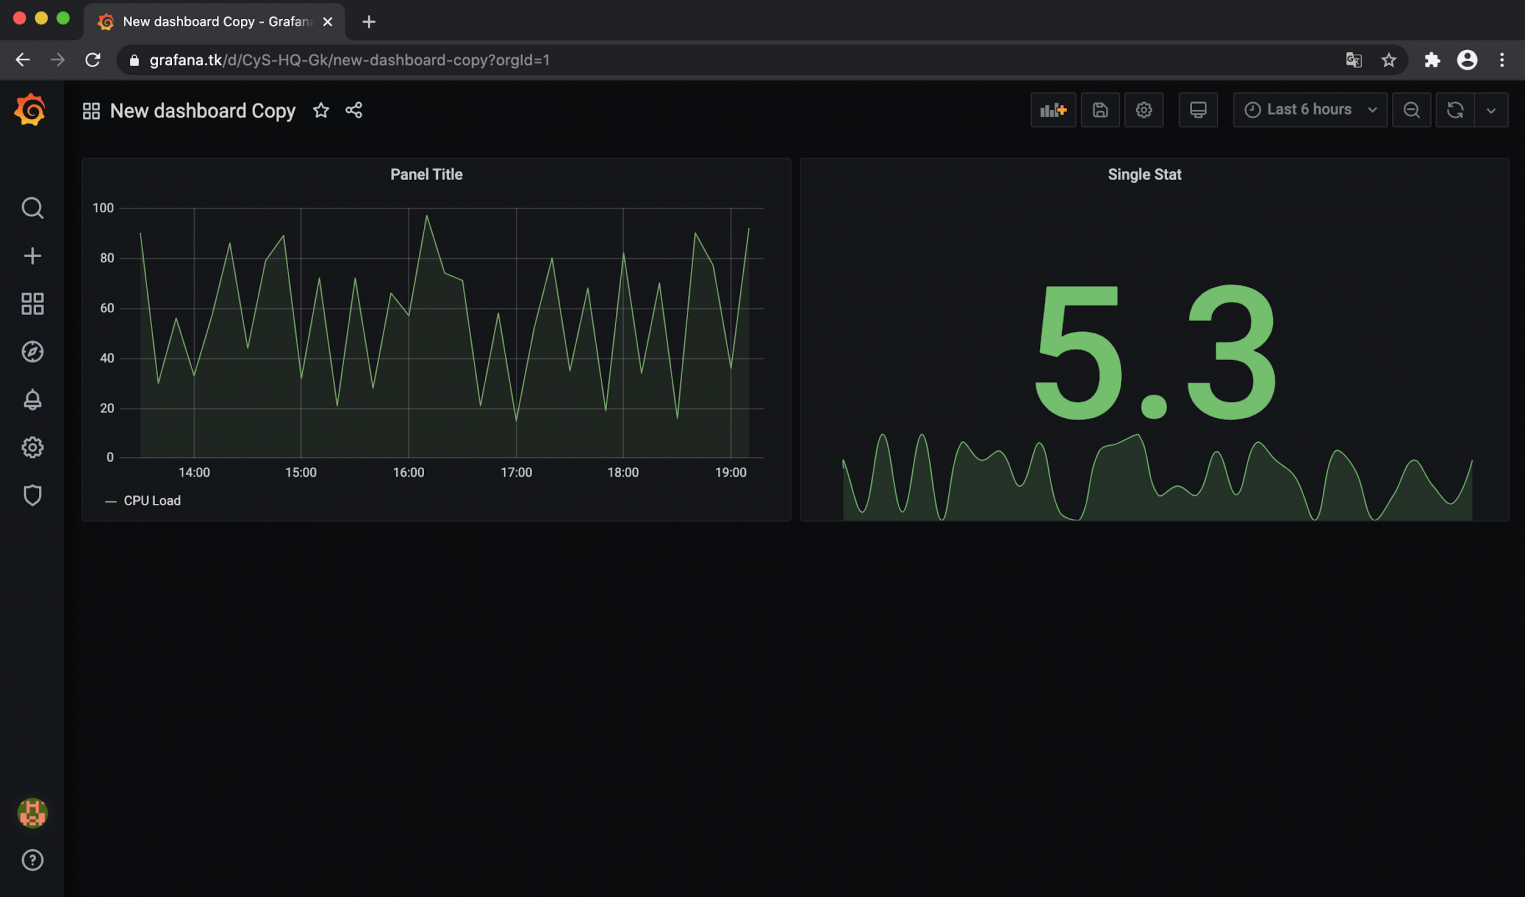
Кроме настроек SSL, в Grafana, для повышения уровня безопасности, можно отключить анонимный доступ и создание новых учетных записей.
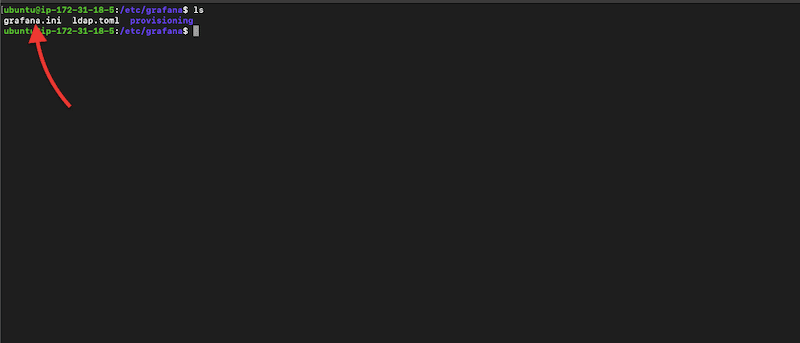
Конфигурационный файл Grafana
Для тонкой настройки Grafana, можно использовать конфигурационный файл (по умолчанию /etc/grafana/grafana.ini). Здесь хранятся параметры, которые можно менять при необходимости. Рассмотрим основные блоки этого файла.
[paths]
data
Директория, в которой Grafana хранит базу данных sqlite3 и другие данные. Эта директория обычно задаётся в стартовом скрипте init.d.
logs
Директория, в которой Grafana хранит логи. Эта директория обычно задаётся в стартовом скрипте init.d.
[server]
http_addr
IP-адрес, на котором будет доступен веб-интерфейс Grafana. Если параметр не указан, то интерфейс будет доступен по всем сетевым интерфейсам сервера.
http_port
Порт, на котором будет доступен веб-интерфейс Grafana. По умолчанию номер порта 3000. Если нужно использовать порт 80, можно настроить переадресацию в iptables:
sudo iptables -t nat -A PREROUTING -p tcp --dport 80 -j REDIRECT --to-port 3000
Для переадресации можно также использовать веб-сервер Nginx или Apache.
protocol
Протокол, по которому будет доступна Grafana. Варианты http или https.
domain
Может использоваться только вместе с опцией root_url (см. ниже). Важно, если вы используете аутентификацию через GitHub или Google OAuth.
enforce_domain
Переадресация на корректный домен, если заголовок хоста не соответствует домену. По умолчанию в значении false.
root_url
Полный URL-адрес для доступа к Grafana через веб-браузер. Важно, если вы используете аутентификацию через GitHub или Google OAuth.
static_root_path
Путь к директории, в которой находятся файлы HTML, JS и CSS.
cert_file
Директория с файлом сертификата (если доступ к Grafana — https).
cert_key
Директория с файлом ключа (если доступ к Grafana осуществляется по протоколу https).
[database]
Grafana нужна база данных для хранения пользователей, дашбордов и других данных. По умолчанию используется sqlite3, которая включена в дистрибутив Grafana.
type
Поддерживаются mysql, postgres или sqlite3 на выбор.
path
Параметр применим только к базе данных sqlite3. Путь к файлу данных.
host
Параметр применим только к MySQL или Postgres. Включает IP-адрес или hostname и номер порта. Например, для MySQL запущенной на одном сервере с Grafana: host = 127.0.0.1:3306
name
Имя базы данных Grafana.
user
Имя пользователя базы данных (не применимо к sqlite3).
password
Пароль пользователя базы данных (не применимо к sqlite3).
ssl_mode
Применимо только к postgres. Доступны опции: disable, require или verify-full.
[security]
admin_user
Имя привилегированного пользователя Grafana. По умолчанию admin.
admin_password
Пароль привилегированного пользователя Grafana. По умолчанию admin.
login_remember_days
Количество дней, в течении которых не требуется повторный ввод логина и пароля.
disable_gravatar
Отключение пользовательской иконки. Устанавливается в true для отключения. По умолчанию имеет значение false.
[users]
allow_sign_up
Устанавливается в false для предотвращения создания новых учетных записей действующими пользователями.
allow_org_create
Устанавливается в false для предотвращения создания новых организаций действующими пользователями. По умолчанию имеет значение true.
auto_assign_org
Устанавливается в true для автоматического добавления новых пользователей в основную организацию (id 1). Когда установлено в false, новые пользователи добавляются в новые организации, которые создаются автоматически.
auto_assign_org_role
Роль новых пользователей будет привязана к основной организации.
[auth.anonymous]
enabled
Устанавливается в true для включения анонимного доступа. По умолчанию находится в значении false
org_name
Устанавливает имя организации, которое будет использоваться для анонимных пользователей.
org_role
Указывает роль для анонимных пользователей. По умолчанию Viewer, а другие доступные Editor и Admin.
[auth.basic]
enabled
Когда установлено значение true (по умолчанию) http api будет принимать соединения с флагом basic authentication.
[auth.ldap]
enabled
Устанавливается в true для включения интеграции с LDAP (по умолчанию: false).
config_file
Путь к конфигурационному файлу LDAP (по умолчанию: /etc/grafana/ldap.toml).
[auth.proxy]
Эта функция разрешает аутентифицироваться в обратном прокси.
enabled
По умолчанию установлено в false.
header_name
По умолчанию установлено в X-WEBAUTH-USER.
header_property
По умолчанию имя пользователя, но также может принимать значение адреса электронной почты.
auto_sign_up
Устанавливается в значение true для включения автоматического входа пользователей, которые отсутствуют в Grafana DB. По умолчанию установлено значение true.
[session]
provider
Валидные значения: memory, file, mysql, postgres. По умолчанию установлено значение file.
provider_config
Эта опция должна быть сконфигурирована отдельно в зависимости от того, какой тип провайдера сессии установлен.
- file: путь к файлу с сессиями, например, data/sessions.
- mysql: go-sql-driver/mysql dsn config string, например, user:password@tcp(127.0.0.1:3306)/database_name
- postgres: ex: user=a password=b host=localhost port=5432 dbname=c sslmode=disable
cookie_name
Имя сессионного cookie в Grafana.
cookie_secure
Устанавливается в true если Grafana находится только за HTTPS-прокси. По умолчанию установлено в значение false.
session_life_time
Как долго длится сессия в секундах. По умолчанию 86400 секунд (24 часа).
[analytics]
reporting_enabled
Когда опция включена, Grafana будет отправлять анонимную статистику на stats.grafana.org. Никакие IP-адреса не записываются. Данные отправляются каждые 24 часа. По умолчанию установлено в true.
google_analytics_ua_id
Если вы хотите отслеживать активности в Grafana при помощи Google analytics, укажите ваш Universal Analytics ID. По умолчанию эта функция отключена.
[dashboards.json]
Если у вас есть система, которая автоматически строит дашборды из JSON-файлов, вы можете включить эту опцию, чтобы новые дашборды были доступны через поиск в Grafana.
enabled
Значение true или false. По умолчанию выключено.
path
Полный путь к директории, содержащей JSON-файлы с дашбордами.
Заключение
Мы рассмотрели подходы к установке, настройке и работе с Grafana. Этот популярный инструмент имеет большое сообщество разработчиков, которые поддерживают проект и разрабатывают новые плагины, дашборды и развивают продукт. У Grafana регулярно выходят обновления и улучшения, поэтому можно без опасений использовать этот инструмент в продакшн средах.
Search code, repositories, users, issues, pull requests…
Provide feedback
Saved searches
Use saved searches to filter your results more quickly
Sign up
Grafana is the king of dashboards and visualizations within the monitoring solutions realm. Its dashboards are so powerful and easy to set up that they are “almost” a de facto standard for monitoring. Grafana is used internationally by companies of all sizes, individuals, and in all sorts of industrial and agricultural use cases. Grafana has even been used internally by the SpaceX control center and Microsoft.
Table of Contents
- Introduction to Grafana
- Grafana’s Strengths and Limitations
- How to Start with Grafana?
- How to Add Data Sources and Configure a Dashboard in Grafana
- Grafana FAQ
1. Introduction to Grafana
In this beginner’s guide, you will learn the basics of Grafana and a few simple steps to get started. You will learn how Grafana works, how to use it, and how to configure it. We will walk you through the installation and deployment process of the Grafana Stack.
What is Grafana?
Grafana is an open-source visualization and analytics platform developed by Grafana Labs. It integrates with third-party tools to collect and store time-series data from different environments, including traditional servers, cloud services, virtual machines, Kubernetes clusters, and more.
The beauty of Grafana is that it allows its users to explore, visualize, query, and alert on this collected data (logs, metrics, and traces) through easy-to-use operational dashboards. Grafana can understand these data sets regardless of storage location.
Grafana Background
Grafana was developed by Torkel Ödegaard in 2013 with the idea of creating something similar to Kibana but focusing on time-series data. The goal was to make time-series data more accessible to everyone who wanted to create beautiful graphs and dashboards based on that data. He met two other entrepreneurs, Raj Dutt and Anthony Woods, and the three started a company based on Grafana. Around 2015, Grafana Labs was born and soon released Grafana v.2.0 (which has remained open-source since then). Grafana was quickly adopted by different organizations and individuals in a large variety of industries. Since then, Grafana has become one of the favorite monitoring tools, primarily due to its ease of use and visually appealing dashboards.
As Grafana OSS (Open Source Software) started to be adopted by large organizations, Grafana Labs quickly introduced two new commercial products, Grafana Enterprise and Grafana Cloud.
Product Details
- Licensing Grafana has an open-source license under the Affero General Public License version 3.0 (AGPLv3). You can find all source code in its main repository: github.com/grafana/grafana
- Operating system support The Grafana Backend is supported by Debian / Ubuntu, RPM-based Linux (CentOS, Fedora, OpenSuse, Red Hat), macOS, and Windows.
- Pricing plan Grafana (Open Source Software – OSS) for visualization is free forever and unlimited. You can also use it free with Prometheus (10K series metrics) + 50 G Blogs and 50 GB traces. Grafana also offers Grafana Cloud (fully managed for free or starting at $8/month) and Grafana Enterprise (self-managed). Contact Grafana sales for pricing on the enterprise stack.
- Other Grafana Labs tools Grafana Labs also provides the Core LGTM Stack that covers Logs (Grafana Loki), Grafana (visualization), Traces (Grafana Tempo), and Metrics (Grafana Mimir and Prometheus).
- Grafana integrations and expansion Grafana can be connected with other data sources or applications via its plugins. It can also be expanded with Grafana alerting, incident, and on-call capabilities. In addition, you can also use the Grafana k6 for performance testing.
- Support The only way to get technical support for Grafana OSS is via its public forums. Plus, there is also excellent documentation and a knowledge base. The support for Grafana Pro and advanced accounts is more dedicated. You can open support tickets (via Cloud Portal) and contact support via email.
- Free Trial Sign up for a 14-day free trial of Grafana Pro (Cloud) or download Free (limited) Forever Cloud.
How Does Grafana Work?
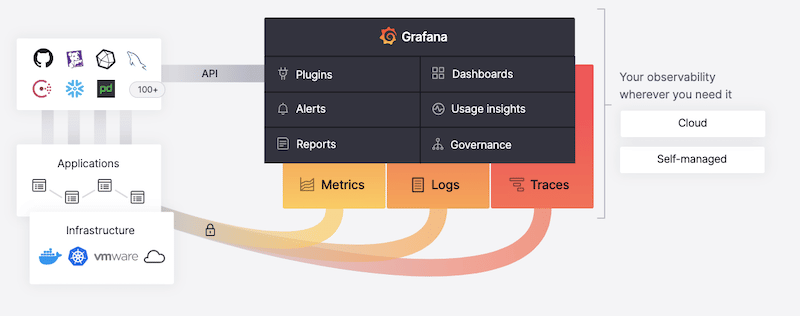
Grafana uses the server-client architecture. The Grafana backend (server) can be self-managed via Grafana OSS Stack or Enterprise or fully managed via the Grafana Cloud. The Grafana server collects telemetry data (metrics, logs, and traces) from your infrastructure or applications using data sources or Grafana agents (clients). The server provides different services for this data, including analysis, graphing, alerting, reporting, and governance.
Grafana does not collect or store data, so it needs external data sources such as InfluxDB, Azure Monitor, Amazon CloudWatch, and Microsoft SQL Server, which can be easily integrated with Grafana. In addition, the Grafana client can also be used as a one-stop solution to collect and deliver telemetry data to the Grafana backend. Grafana can also be integrated using plugins (via API) to other monitoring tools like Prometheus, Splunk, Graphite, and much more.
2. Grafana’s Strengths and Limitations
Strengths of Grafana
- Grafana’s strengths are dashboards and visualizations Grafana offers visually appealing and highly customizable dashboards. Grafana’s interactive data visualization platform allows its users to analyze data easier, track performance, identify trends, and detect irregularities.
- Grafana can monitor multiple clouds One of the most significant advantages of Grafana is that it lets you collect and visualize metrics from the leading cloud providers, including Amazon AWS (CloudWatch), Microsoft Azure (Monitor), and Google Cloud.
- Amazing integrations Grafana can be integrated via plugins with a large and diverse set of third-party tools. Some of the most popular (aside from the cloud data sources) are Prometheus, InfluxDB, MySQL, Splunk, and Elasticsearch. In addition, Grafana also offers integrations via its Grafana agent, which can be installed in Linux hosts, Windows, Nginx servers, Kubernetes clusters, and more.
Limitations of Grafana
- Grafana is limited in data collection and storage Grafana’s software is the best at graphs and dashboards, but it is limited regarding data sources. Although it can collect time series data from particular types of infrastructure or applications on its own (via agents) it still requires different storage backends (as data sources) to feed data into Grafana. So, Grafana depends on other solutions. It needs to be integrated with third-party ‘external’ data sources such as Prometheus, InfluxDB, MySQL, Azure Monitor, or Amazon CloudWatch.
3. How to Start with Grafana?
In this section, we will go through the steps for starting with Grafana. We will install the Grafana backend, begin its configuration, and open the web user interface.
Requirements
Before installing the Grafana OSS server stack, you’ll need to consider the following software and hardware requirements. Grafana can be installed in the following supported operating systems: Linux (Debian/Ubuntu, or RPM-based, CentOS, Fedora, OpenSuse, and Red Hat), macOS, and Windows. Grafana can also run through container-based Docker images or be deployed through Kubernetes clusters.
Grafana requires an updated web browser for its User Interface. It is supported by the newest versions of Chrome, Firefox, Safari, Microsoft Edge, and Internet Explorer 11. In addition, Grafana needs a database to store users, data sources, and dashboard information. It supports SQLite 3, MySQL 5.7+, and PostgreSQL 10+.
Regarding the hardware requirements, Grafana recommends a minimum memory of 255 MBs and CPU 1.
Install Grafana (Server)
We will start by installing Grafana’s dependencies, proceed to download and install Grafana, and ensure the service is up and running.
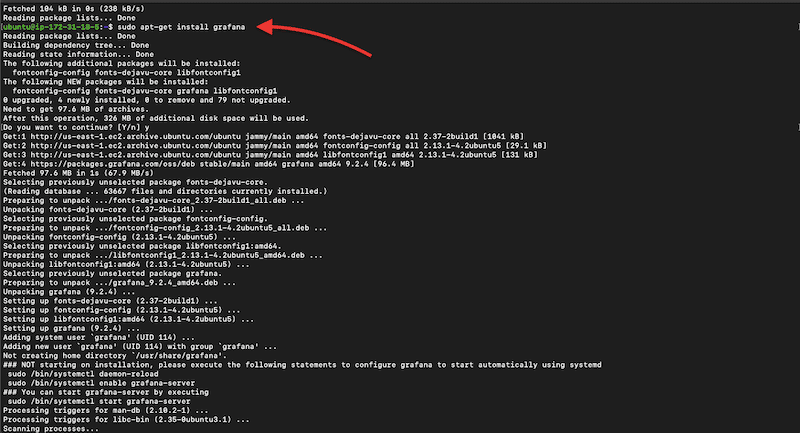
NOTE: For illustration purposes, we will install the latest Grafana OSS version on an Ubuntu (22.04) server through the APT repository. Installing Grafana from the APT repository guarantees that Grafana is updated every time you issue an ‘apt-get update’ command. Note that you can also install Grafana from the .deb package or the binary .tar.gz file.
- Download Grafana from its official APT repository. We will download the Grafana OSS stable release.
- Use the following commands to install the dependencies.
$ sudo apt-get install -y apt-transport-https
$ sudo apt-get install -y software-properties-common wget
$ sudo wget -q -O /usr/share/keyrings/grafana.key https://packages.grafana.com/gpg.key
- Since we are installing the latest stable release (and not beta), we will add the stable release repository
$ echo "deb [signed-by=/usr/share/keyrings/grafana.key] https://packages.grafana.com/oss/deb stable main" | sudo tee -a /etc/apt/sources.list.d/grafana.list
- Let’s install the latest Grafana OSS release
$ sudo apt-get update
$ sudo apt-get install grafana
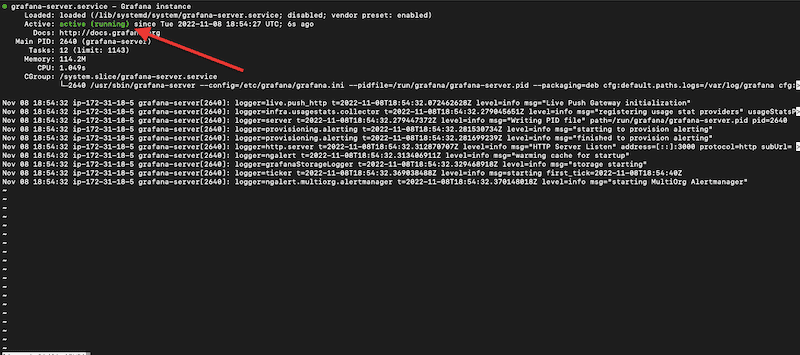
- Now, let’s start the Grafana-server process. We will start the server and verify its state using the following set of commands:
$ sudo systemctl daemon-reload
$ sudo systemctl start grafana-server
$ sudo systemctl status grafana-server
- Make sure the server is active and running
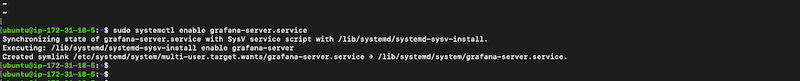
- To ensure the service stays active, let’s configure the Grafana server to start at boot with the following command.
$ sudo systemctl enable grafana-server.service
Configuring Grafana
You can start configuring Grafana through its “configuration files” or by using environmental variables. Grafana comes with default config files, which you can customize by adding custom options and removing the comments from different sections within the configuration file.
- The location of this configuration file will vary from OS to OS. For our Linux Ubuntu instance, the custom configuration file can be found on /usr/local/etc/grafana/grafana.ini.
- While in the directory ‘/usr/local/etc/grafana/’ open the grafana.ini using your favorite text editor.
$ sudo vi grafana.ini
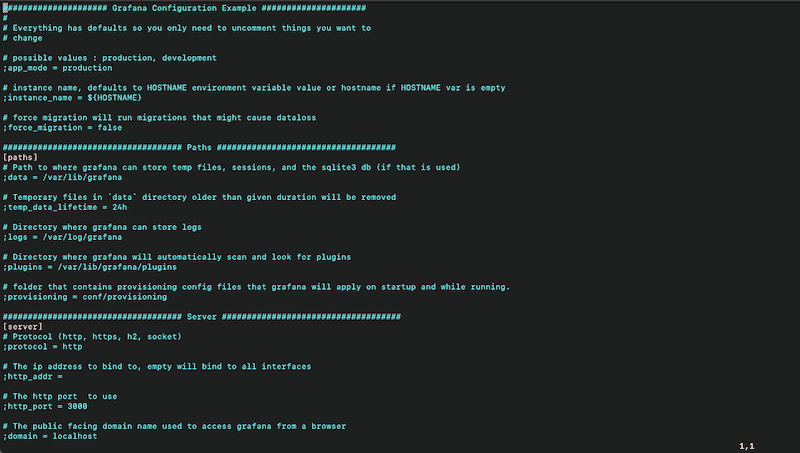
- You can change the parameters in this Grafana configuration file (grafana.ini) by removing the comments. Grafana uses the semicolons (;) as comments in the grafana.ini file. To enable a line of configuration, you’ll need to remove the semicolon (;).
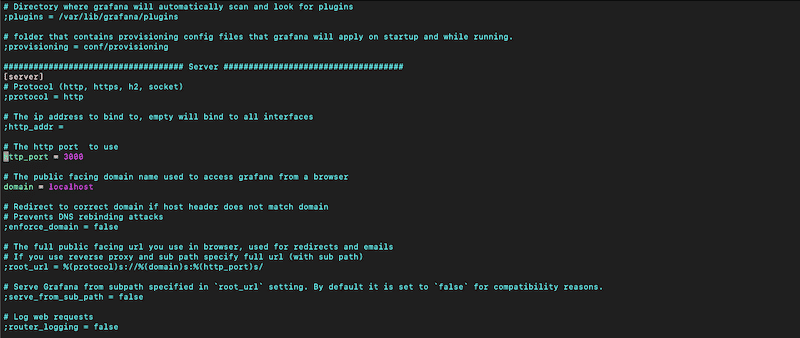
- As an example, let’s change the Grafana port and public-facing domain.
- If you want to change the default HTTP port (3000) to use when opening the Grafana server, remove the “;” and set the value.
- In addition, you may want to change the public-facing domain name used to access the Grafana server from a browser. Choose any other domain than “localhost”, for your Grafana server.
NOTE: Further configuration of the Grafana server is outside the scope of this Beginner’s Guide.
- After making configuration changes on your Grafana server, you’ll need to restart it. To restart the services with ‘systemd’ as we did in the previous section, run the following commands:
$ sudo systemctl restart grafana-server
$ sudo systemctl status grafana-server
Opening Grafana for the First Time
To open Grafana’s Web UI, follow the next steps.
- Go to a supported web browser and type the following address: http://localhost:3000. If you have changed the default HTTP port (as shown in the previous section), then use the new port (and not 3000.)
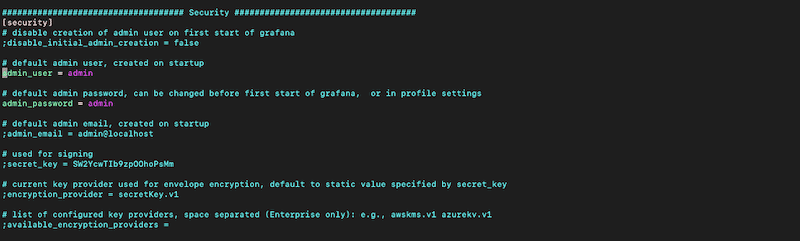
- Enter the credentials If you haven’t changed default values, the default admin user is “admin,” and the password is “admin.” But still, on the first start of Grafana, you’ll be asked to create a new admin password.
- You’ll still be able to change these credentials by opening the grafana.ini configuration file and changing the values on the “Security” menu (as shown in the screenshot below).
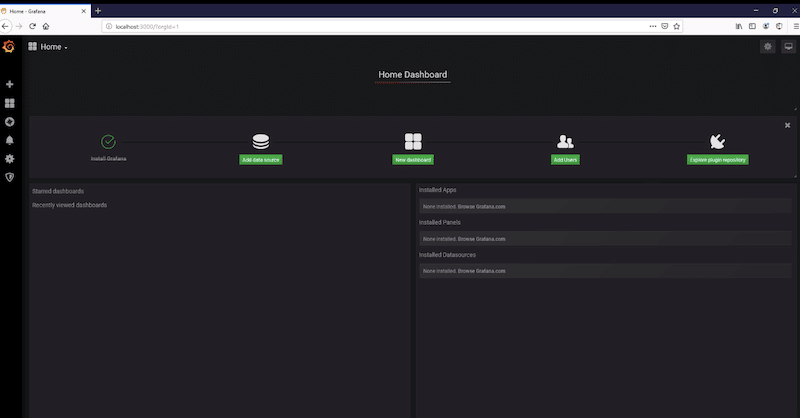
- Once you open the Grafana UI for the first time, it will be empty.
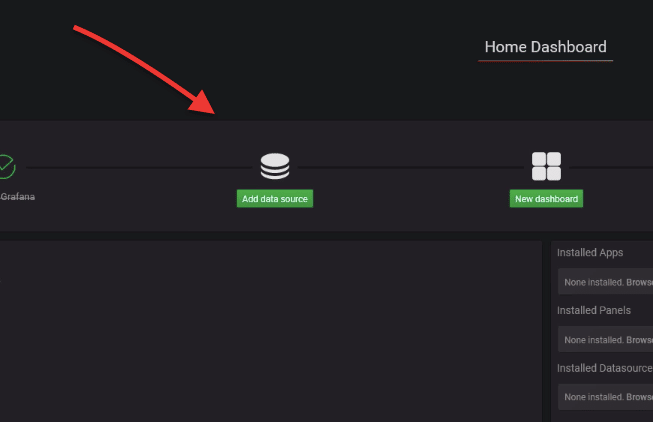
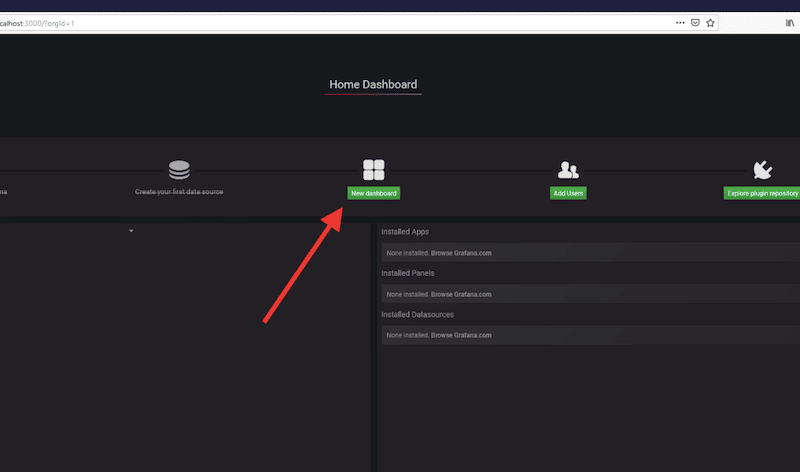
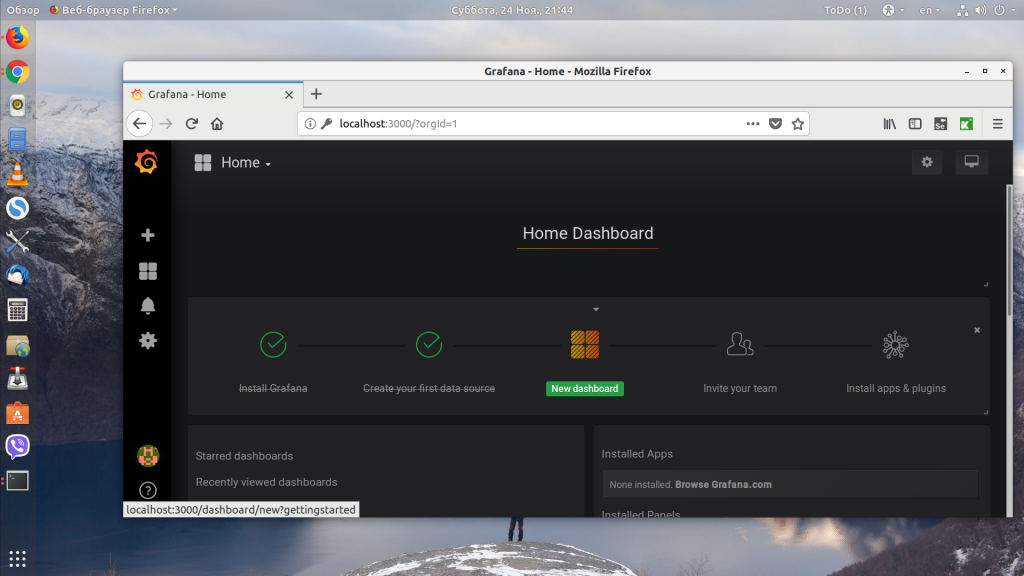
- Refer to the screenshot below. As the configuration flow shows on the Grafana Home Dashboard, after Installing Grafana, you’ll need to “Add a data source,” create a “new dashboard,” “Add users,” and finally, “Integrate with other apps”.
- Once you have Grafana data sources (clients or plugins) sending data to your server (and your server is fully configured), you should start seeing your dashboard with visualizations.
- In the next section, we will add a data source.
4. How to Add Data Sources and Configure a Dashboard in Grafana
Grafana supports various types of storage backends to collect and store time-series data. Grafana Labs has created many plugins so that you can easily integrate these data sources with Grafana. Popular data sources include Azure Monitor, CloudWatch, Elasticsearch, GoogleCloud Monitoring, Graphite, InfluxDB, MySQL, and more.
Once you have integrated your first data source right from the Grafana UI, you can create dashboards to display this data via visualizations. Keep in mind that each data source has its unique query editor so that you can write specific queries that include the characteristics of the data being monitored.
In addition, although you can combine different data sources into a single dashboard, each panel shown on a dashboard is linked to a specific data source.
Adding a New Data Source on Your Grafana UI
- On the home dashboard, click on the ‘configuration’ on the side menu. Next, click on ‘Data sources’, and ‘Add data source. Or, you can simply click the ‘Add data source’ on the configuration flow.
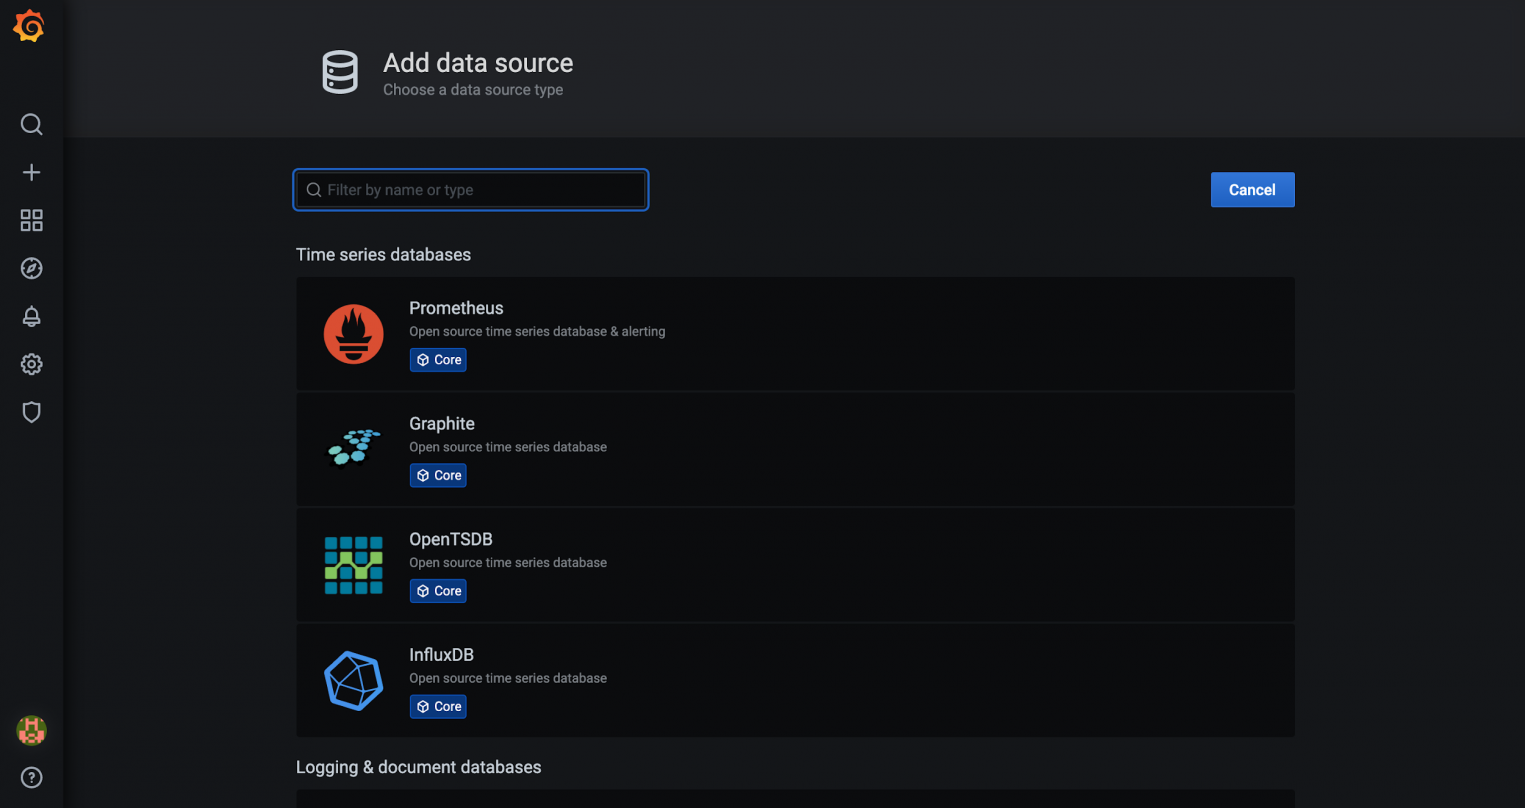
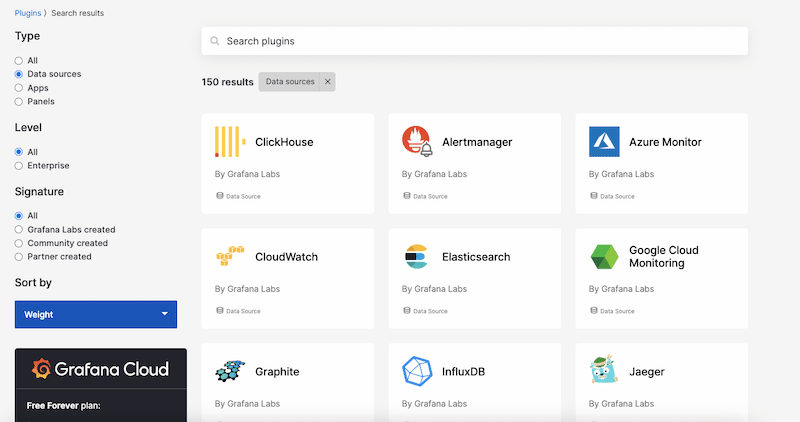
- The following window, “Add data source,” will show you a list of all supported data sources. You’ll find data sources sorted into different categories, including time series databases, logging, and document databases, SQL, distributed tracing, cloud, and more.
- Select the correct data source for your Grafana deployment. If you don’t find a specific data source, search for it using the search dialog.
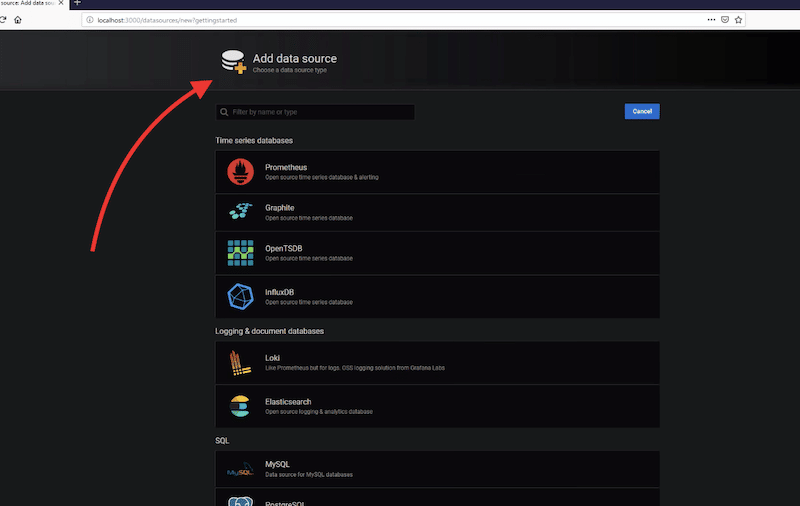
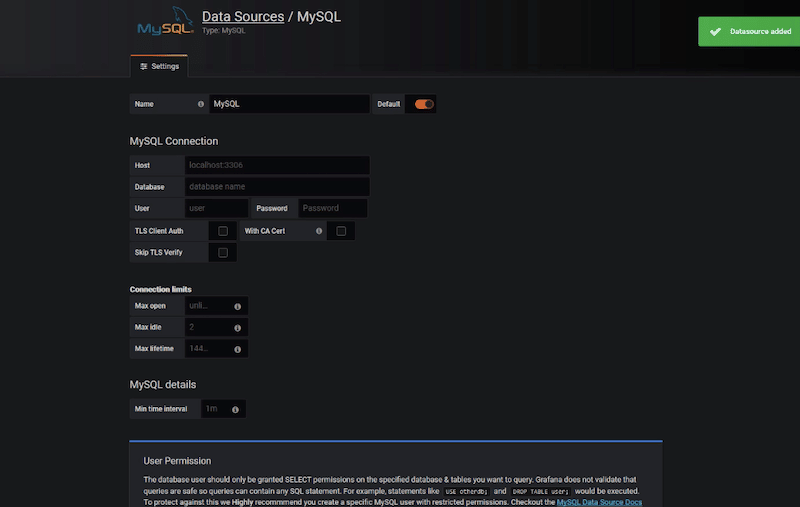
- Click on “Select”, and a new configuration window will open. Fill in all your data source information.
- For instance, to configure MySQL as a data source, you’ll need to give it a name, IP or domain (with the port), database name, credentials, and other settings, such as whether to use TLS or CA certification.
- Click on “Save and Test”.
Configuring Your First Dashboard in Grafana
If you have successfully added a data source in Grafana, now you should be able to add a dashboard that creates visualizations using the data collected from the data source.
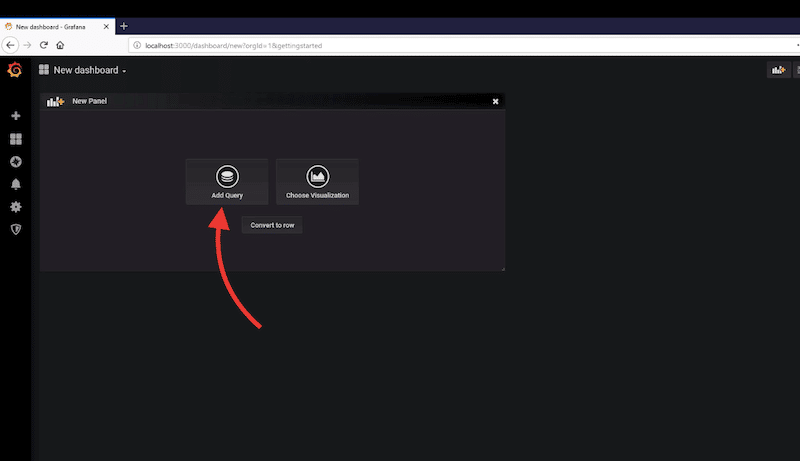
- To add your first dashboard in Grafana, click on the “New dashboard” icon in the initial configuration flow.
- Now, you can add new panels with different data sources. As mentioned before, each panel is connected to a single data source. So, to get data to appear in Grafana visualizations, you’ll need to create data source queries. Keep in mind that the query language will vary depending on the data source you are querying.
- Configure your new panel with “Add Query”.
- As you will notice, Grafana creates a brand-new template dashboard that can be fully customized.
- Ensure that you are selecting the correct query for that panel. Click on the drop-down menu next to “Query”. Below you’ll need to set up extra parameters such as timeframes, groups, columns, etc.
- Detailed configuration of Grafana dashboards is beyond the scope of this guide. For more information on how to configure Grafana dashboards, check Grafana’s official documentation.
Other Ways to Feed Data into Grafana Stack
Although configuring a data source in Grafana is the easiest way to get time-series data into the Grafana server, there are also various advantages to using the Grafana Agent. The Grafana agent collects and sends metrics, logs, and trace data to the Grafana server.
The Grafana agent is built with OpenTelemetry (OTEL)— an observability framework used to generate and capture telemetry data (traces, metrics, and logs) from cloud-native software.
The advantages of using the Grafana agent are:
- The agent can seamlessly collect metrics, logs, and traces for the Grafana Stack.
- The Grafana agent can be used to send telemetry to other compatible endpoints, such as Prometheus.
- The Grafana agent provides out-of-the-box dashboards and alerts.
Another way to get data into the Grafana Stack (Cloud or Enterprise) is by integrating existing monitoring instances from Prometheus, Loki, Tempo, or Graphite. Rather than having distributed instances (and data) for monitoring, Grafana lets you centralize data storage and logging. Grafana can be integrated with these tools to create dashboards that aggregate data, improve queries, and provide alerting across all these separate data sources.
5. Grafana FAQs
Observability vs. monitoring: What are the differences?
Observability is not knowing in advance what will be monitored. It explores the patterns and properties of a system. Monitoring, on the other hand, can be considered a task where predefined sets of metrics and logs are gathered to be monitored for status and health. Grafana can be used for both cases.
What are some alternatives to Grafana?
A good monitoring solution should not only be able to capture and visualize metrics but it should also help troubleshoot, analyze logs, and visualize different components. Some good alternatives to Grafana are Elastic Stack (including Kibana, Logstash, and Elasticsearch), Splunk, and Datadog.
What is not Grafana?
Grafana is not a data collection and storage tool. It does not provide direct data collection and storage as tools like Prometheus.
What are the differences between Grafana and Splunk?
Splunk is a fully featured log analysis software that empowers observability and unified security in distributed and hybrid environments. Grafana, on the other hand, focuses on data visualization. Both tools can work together: Splunk can be configured as a data source (via plugin) to take data into Grafana dashboards and visualize it.
Grafana vs. Prometheus: what are their differences?
Both are open-source and free solutions built to improve the monitoring of time-series data. On the one hand, Grafana is a leader in metrics visualization, while Prometheus is better for its metrics data collection and storage. Both tools can be combined into a robust monitoring solution suitable for monitoring all sorts of infrastructure and applications.
So what can we do to improve database performance?
Grafana helps you identify and tackle performance issues by giving you the tools you need to analyze and monitor your database. Not only does it help solve problems, but it also aids you in becoming proactive with your maintenance by using alerts. Grafana is open source, compatible with a wide range of databases, and has a thriving community.
This Grafana tutorial will cover the installation, configuration, and creation of your first dashboard using Grafana to monitor a MySQL database.

What Is Grafana?
Grafana is a database analysis and monitoring tool. It allows you to create dashboard visualizations of key metrics that are important to you. Grafana has a thriving community of enthusiasts who share reusable dashboards.
Grafana supports a huge number of data sources. And, since the application is open source, you can be sure that the moment a new data source has been released, someone out there is adding support for it. The most common use case of Grafana is displaying time series data, such as memory or CPU over time, alongside the current usage data.
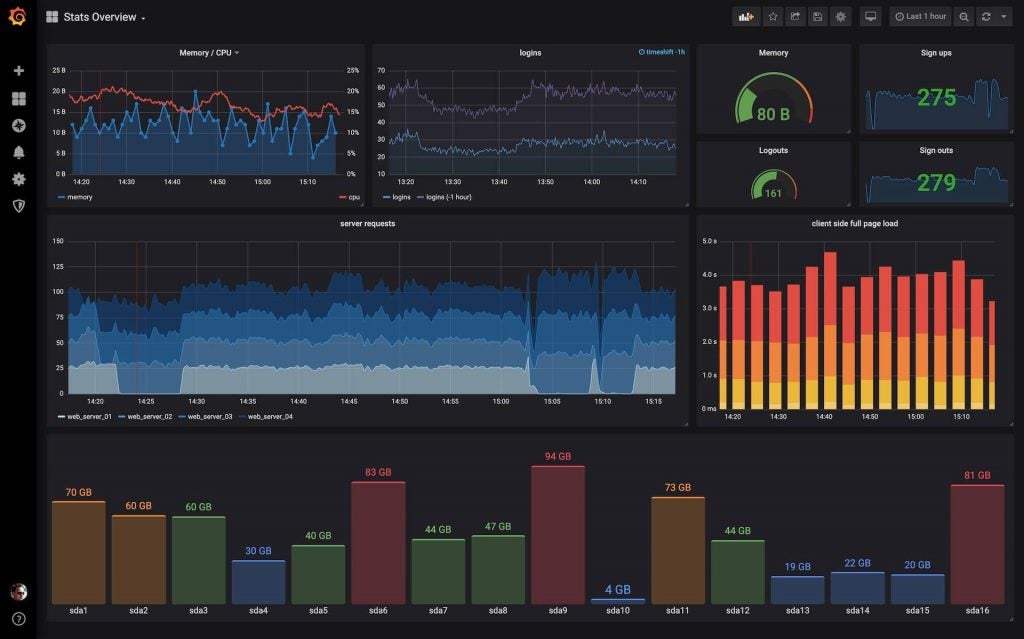
You can host Grafana yourself, use the managed service in AWS or get the creators to host it for you. Grafana runs as a process on your computer or server, and you access the interface through your browser. Your dashboard can display your data as single numbers, graphs, charts, or even a heat map. Below is an example dashboard set up through the Grafana web interface:
Installing Grafana Locally
The instructions for installation depend on where you plan to run Grafana. I normally run applications like this locally to get a feel for how it works before deploying remotely. Grafana provides comprehensive instructions for wherever you want to deploy it.
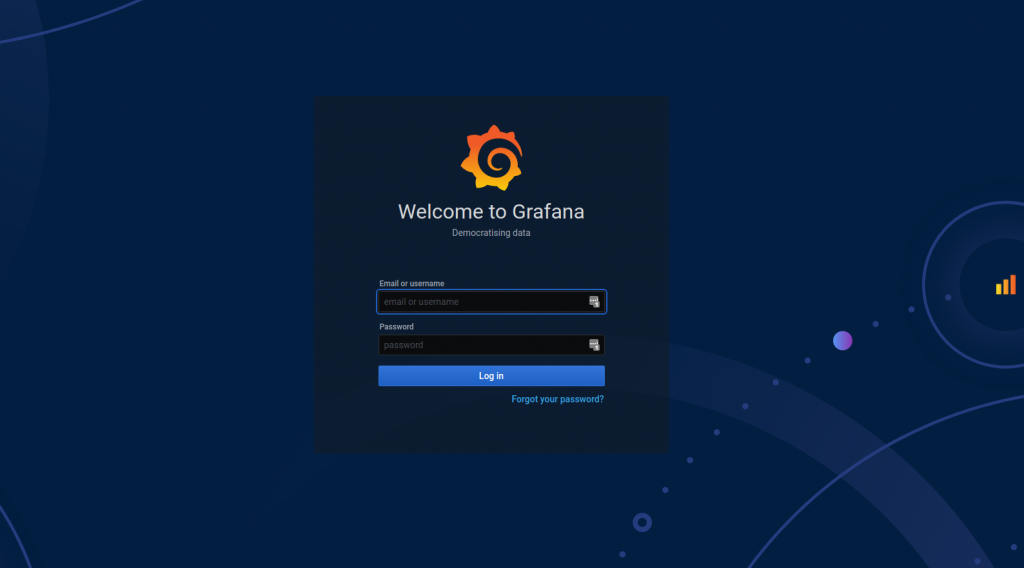
If the installation was a success, then Grafana should be available through your web browser by default on http://localhost:3000, and your screen should look like the image below. The default username is admin and the default password is also admin. You will be asked to change your password after logging in.
Configuring Your DataSource
Configuring your data source is the first step to setting up your Grafana dashboard. Your data source could be a database or a collection of logs. Grafana supports pretty much every data source you can think of, from traditional databases like MySQL to log aggregation platforms like AWS Cloudwatch.
Now we’ll walk through configuring Grafana to connect to your MySQL database. For my example, I’ve created a database named CD with a table called Artist to simulate a database behind a music library app.
Your first step is to add a Grafana user to your database. In your MySQL database, run the following in the database administrator role to add a read-only user named grafanaReader to your database CD for the table Artist:
CREATE USER 'grafanaReader' IDENTIFIED BY 'password';
GRANT SELECT ON CD.Artist TO 'grafanaReader';
To add a link from your database to Grafana, switch back to the Grafana interface.
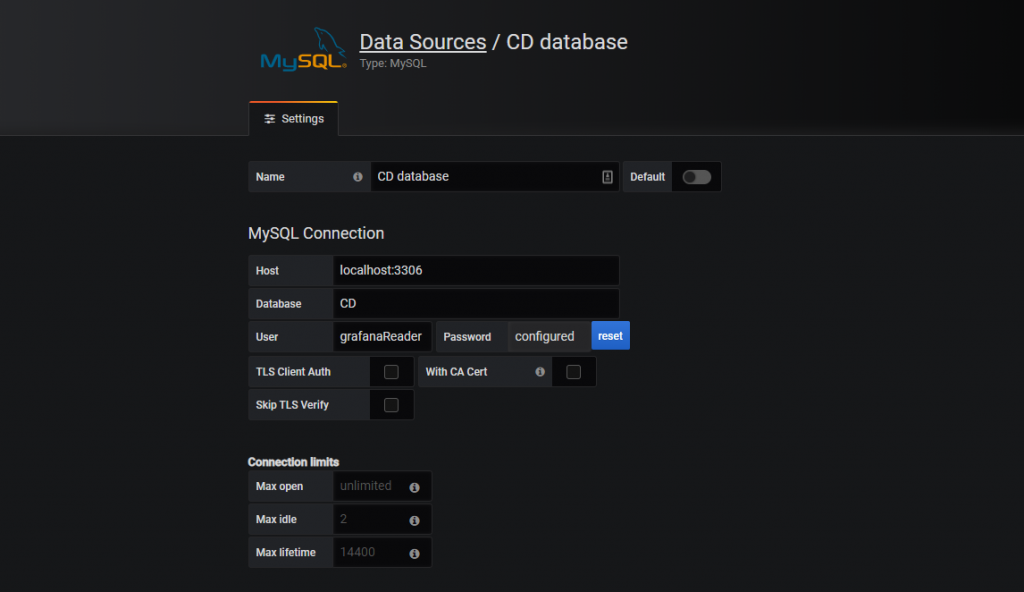
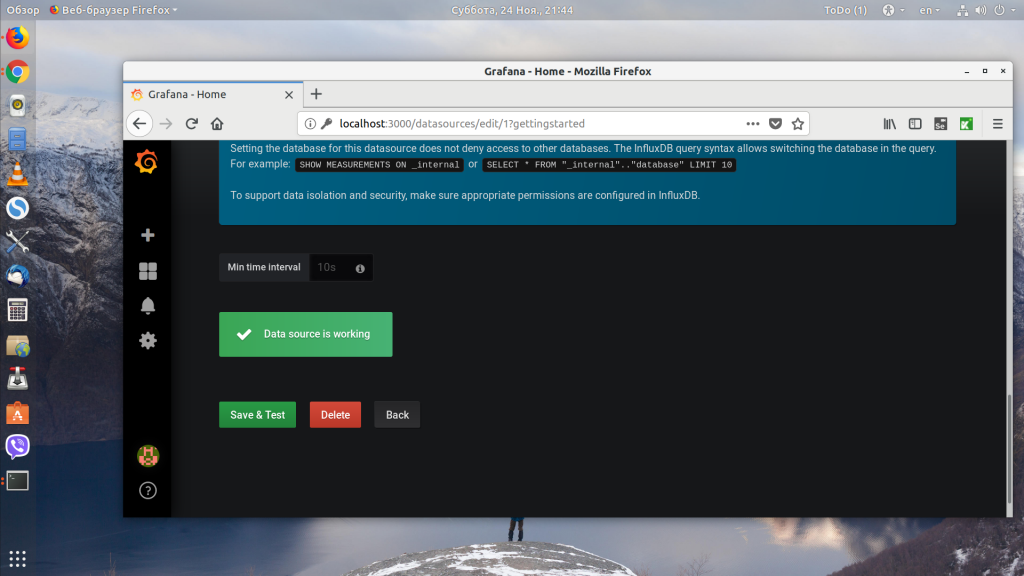
The first option on the display is Create your first datasource. Complete the web form with your connection details. I’m using a local MySQL database running on localhost on port 3306 for the database CD and with the user we made previously, grafanaReader. It’s safe to leave the rest of the fields as default. Hit save and test. If everything is configured correctly, you should see a green box with the message Database Connection OK.
Now that your database is connected, you are ready to create your first dashboard! I’m going to create a dashboard showing stats about the CD database we connected in the previous section.
Dashboards are made from panels of information organized into rows. I’m creating a dashboard from one datasource, but you can use different data from different sources in the same dashboard.
Panels represent a visual representation of a query. Each panel can show the same or different data using a visualization that is the easiest for you to process. The first panel will show the total number of Artists in our CD database.
Single Stat Panel
To show a single number, we use the single stat panel. Switch back to Grafana again. You now have the option create your first dashboard. Choose this option, then select Add new panel.
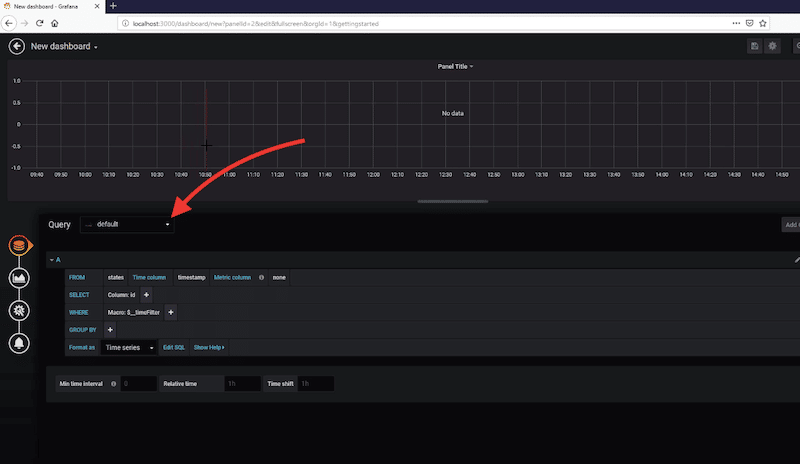
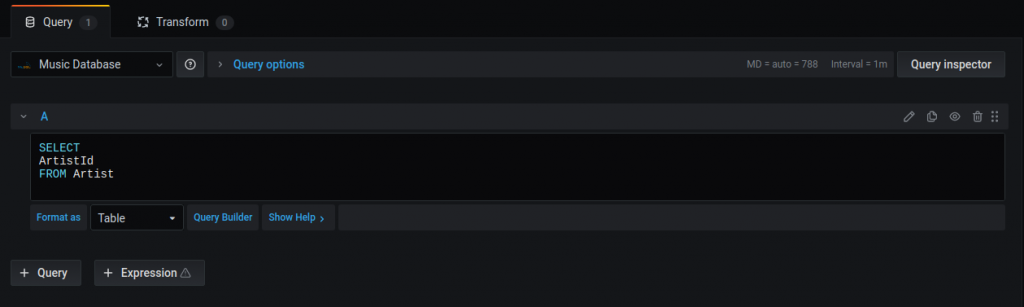
Select your database from the Query drop-down menu and choose to format this query as a table in the format as drop-down. Select the Edit SQL link and paste the following SQL:
SELECT ArtistIdFROM Artist
This assumes you have a table called Artist and a column named ArtistId. You can change the names of the column and the table to fit your data. Your Query page should look like the screenshot below:
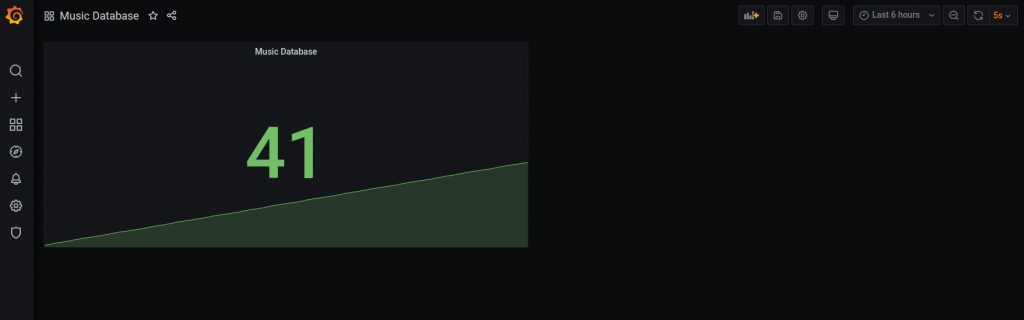
On the right hand side on the panel tab expand the Visualization menu and choose the stat icon. This will immediately give you a preview of your panel showing the sum of records in your table.
Finally, click the settings icon to give the panel a meaningful name, such as Total Artists. You have now created your first panel! You also now have a dashboard with a single panel. Something like the view below:
At the top right of the screen, you can select how often the database will be queried to get up-to-date information. Set it to 5s to refresh the box every 5 seconds. You can now change the data in your database and see the update on the screen!
Easily Share Your Grafana Dashboard with Others
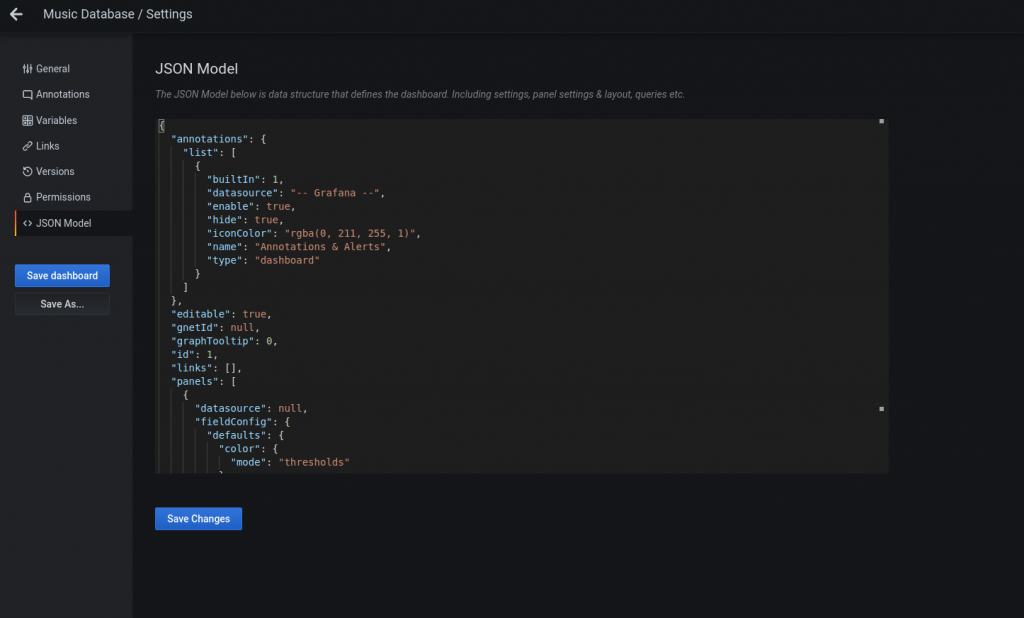
A feature that makes Grafana really popular is the ability to easily share dashboards with others. To export your dashboard, select the cog icon at the top right of your dashboard. The tool tip will read Dashboard Settings. Select JSON Model from the left navigation menu and you can see your dashboard as JSON. Sharing your dashboard is as simple as saving this file and passing it to someone else to load into their instance. Below shows how my dashboard looks as JSON.
Make Impressive Dashboards with Help from Scalyr
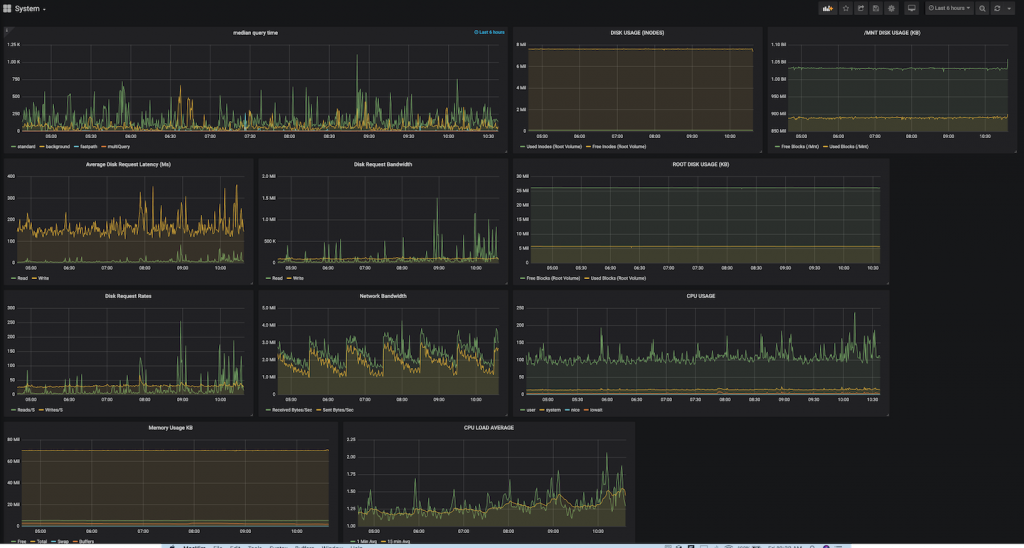
Having a dashboard with the number of records in your database is useful–but not very impressive. I normally start my dashboards using existing logs. If you don’t already have a central place to store the logs from different parts of your application, try Scalyr with your Grafana dashboard now. You can add Scalyr as a data source to your dashboard using an open source plugin. With the plugin you can view log based metrics in Grafana, then click straight through to the Scalyr site to view your logs in more detail. The dashboard below shows an example of the impressive dashboards you can make with Scalyr.
Grafana Can Display All Your Data in Whatever Format Works Best
Grafana is an open source database analysis and monitoring tool that is easy to install on any operating system. It’s accessed through a browser, so it can be deployed to your favorite hosting company and can then be accessed by your whole team.
You can display all your data (even from multiple sources) in whatever format works best for you. There is a wide selection of visualizations built in and accessible through the community. You can customize your panels with color and transparency—whatever makes sense for your visual. You can even make your own visualization plugins if you want something a little more specific to your use case.

In this Grafana tutorial, you learned how to set up your first dashboard. There is loads more to learn, and I highly recommend joining the community to share your creations. You can learn some of the best practices and learn from the experts who have been creating these visuals for years.
Grafana is not just for when you have performance issues. You can proactively set up alerts to notify you when a value reaches a threshold to keep one step ahead of your performance issues. The dashboard looks so good that you’ll soon be putting monitors with all your dashboards up all over the office. It can become an obsession!
Если работаешь системным администратором или аналитиком, то часто приходится отображать данные о событиях или статистику в виде графиков и диаграмм, в зависимости от времени, когда они произошли. Для этого существует множество инструментов, и об одном из них мы поговорим в этой статье.
Сегодня рассмотрим установку и настройку Grafana — веб-инструмента для представления данных, связанных со временем, в виде очень красивых графиков и диаграмм. В качестве источника данных для Grafana можно использовать как множество различных сложных движков баз данных, включая Graphite, ElasticSearch, InfluxDB, Prometeus, так и более простых, например MySQL. В этой статье мы рассмотрим, как установить Grafana в Ubuntu 18.04, а также как настроить её для работы с influxdb.
Установка Grafana в Ubuntu
В официальных репозиториях дистрибутива пакета для этой программы нет, но вы можете установить её из официального репозитория самой программы. Чтобы добавить репозиторий, выполните такие команды:
curl https://packagecloud.io/gpg.key | sudo apt-key add -
sudo add-apt-repository "deb https://packagecloud.io/grafana/stable/debian/ stretch main"
Затем нужно обновить список пакетов:
sudo apt-get update
Установка Grafana Ubuntu:
sudo apt-get install grafana
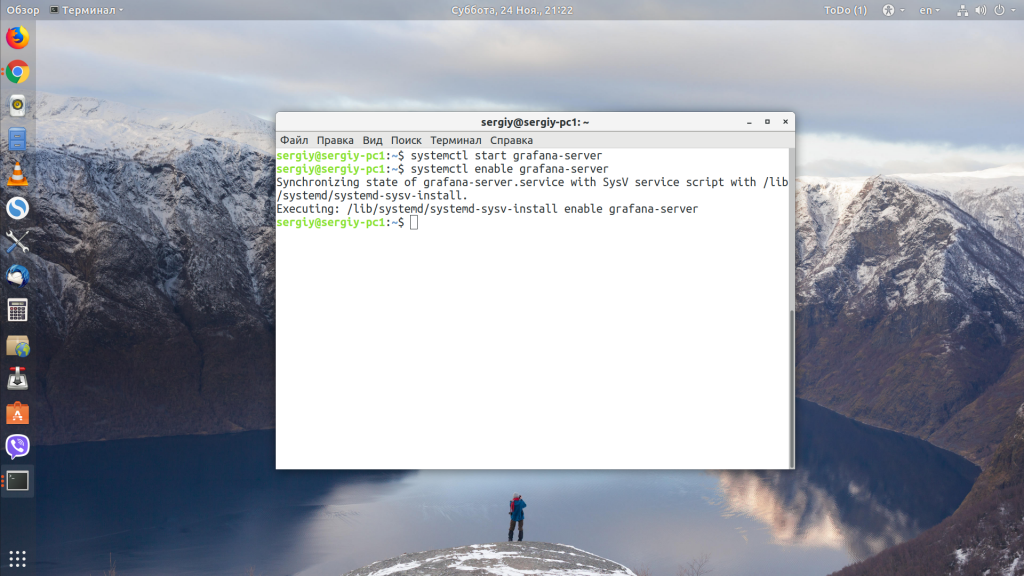
Затем запускаем сервис и добавляем его в автозагрузку:
sudo systemctl start grafana-server
sudo systemctl enable grafana-server
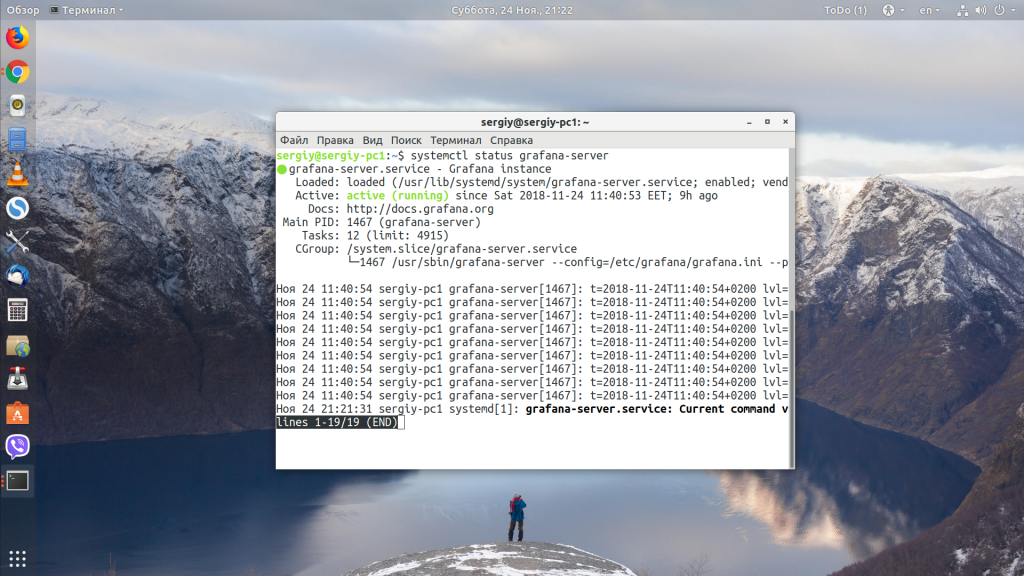
Теперь убедимся, что сервис действительно запущен и не произошло никаких ошибок:
sudo systemctl status grafana-server
Если всё прошло хорошо, то в выводе вы увидите сообщение active(running), выделенное зеленым цветом.
У Grafana своя система авторизации, поэтому закрывать её обратным прокси не обязательно, если вы, конечно, не собираетесь добавлять для интерфейса SSL-сертификат. Но по умолчанию интерфейс доступен на порте 3000. Нам нужно добавить его в исключения брандмауэра. Для этого выполните:
ufw allow 3000/tcp
Если на вашем сервере брандмауэр не настроен, то ничего делать не надо, порт будет доступен по умолчанию.
Установка Grafana в CentOS
В CentOS программа устанавливается похожим образом. Только добавление репозитория будет выглядеть совсем по-другому. Для добавления официального репозитория продукта создайте файл /etc/yum.repos.d/grafana.repo со следующим содержимым:
vi /etc/yum.repos.d/grafana.repo
[grafana]

name=grafana

baseurl=https://packagecloud.io/grafana/stable/el/7/$basearch

repo_gpgcheck=1

enabled=1

gpgcheck=1

gpgkey=https://packagecloud.io/gpg.key https://grafanarel.s3.amazonaws.com/RPM-GPG-KEY-grafana

sslverify=1

sslcacert=/etc/pki/tls/certs/ca-bundle.crt
Сохраните изменения с помощью :w, и можно устанавливать Grafana:
yum -y install grafana
Затем, таким же образом, запустите сервис и добавьте его в автозагрузку:
systemctl start grafana-server
systemctl enable grafana-server
Для управления брандмауэром в CentOS используется команда firewalld. Чтобы разрешить доступ к программе извне, выполните:
firewall-cmd --add-port=3000/tcp --permanent
firewall-cmd --reload
Grafana готова к использованию.
1. Первый вход
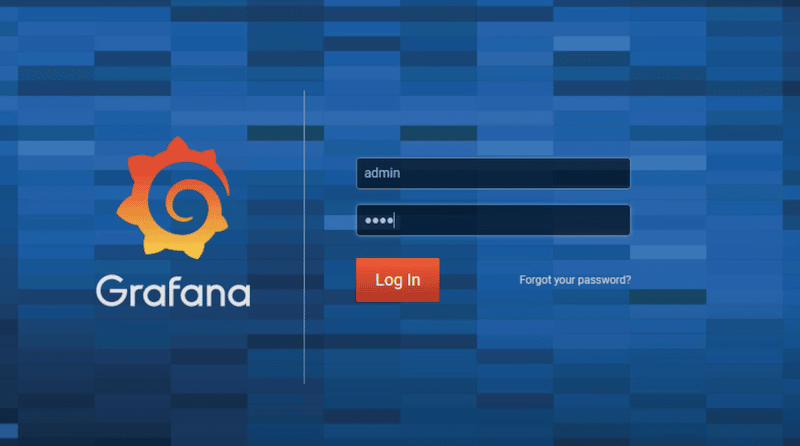
Чтобы войти в интерфейс Grafana, нужно ввести в адресной стройке адрес http://localhost:3000 при условии, что вы устанавливали сервер на локальный компьютер. Если программа установлена на другой компьютер или сервер, то нужно ввести именно его адрес.
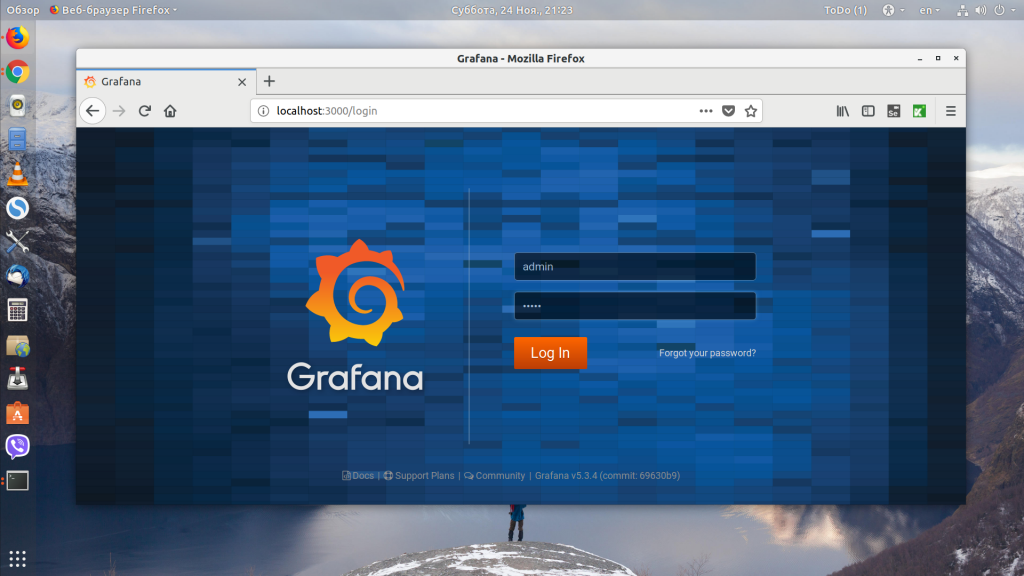
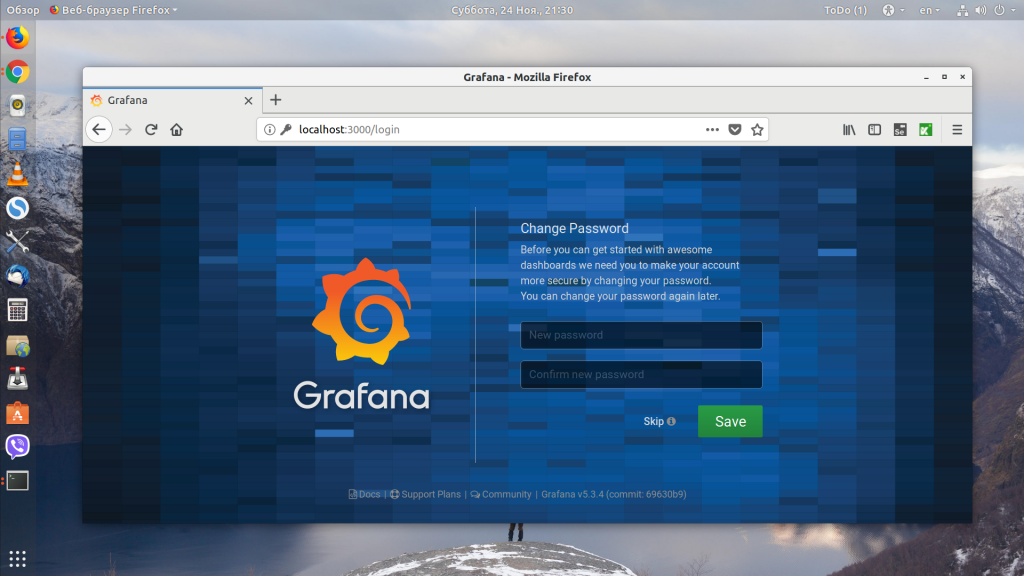
При первом входе система спросит ваш логин и пароль. По умолчанию это admin — admin. Сразу же после успешного входа вам будет предложено ввести новый пароль для администратора:
2. Источники данных
Дальше вы будете перенаправлены на домашнюю страницу:
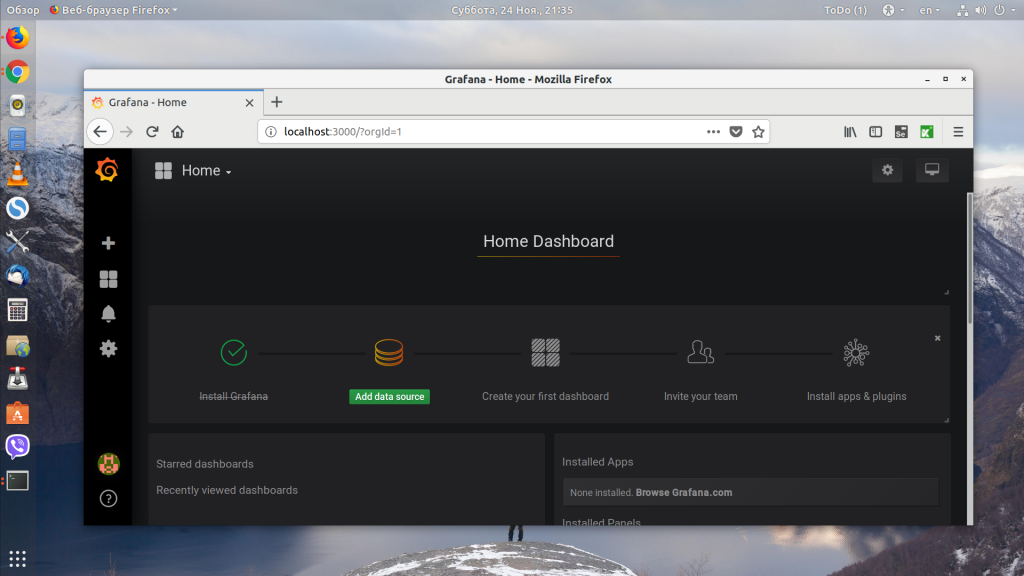
Здесь нам система предлагает добавить источники, откуда будут загружаться данные. Для этого нажмите на зеленую кнопку Add Data Source:
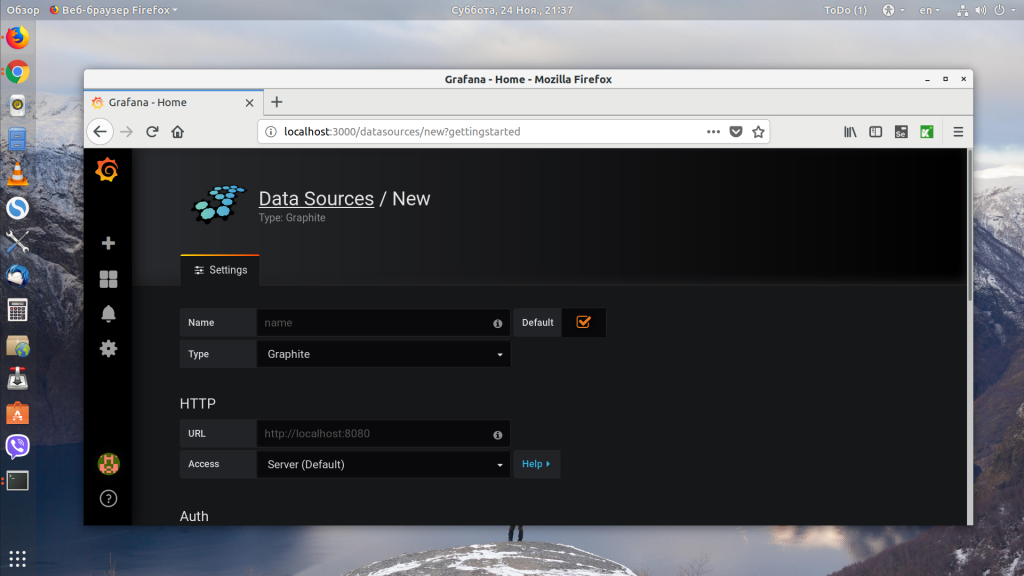
В открывшемся окне введите названия ресурса и выберите его тип, движок, откуда будут браться данные. В этом примере я буду использовать InfluxDB:

В разделе HTTP надо ввести IP-адрес сервера, где находится наша база данных InfluxDB или другой ресурс. InfluxDB, как и ElasticSearch, использует обычный HTTP API для выполнения запросов, который доступен на порте 8086. Таким образом, если вы установили базу данных на локальный компьютер, адрес будет таким — http://localhost:8086:
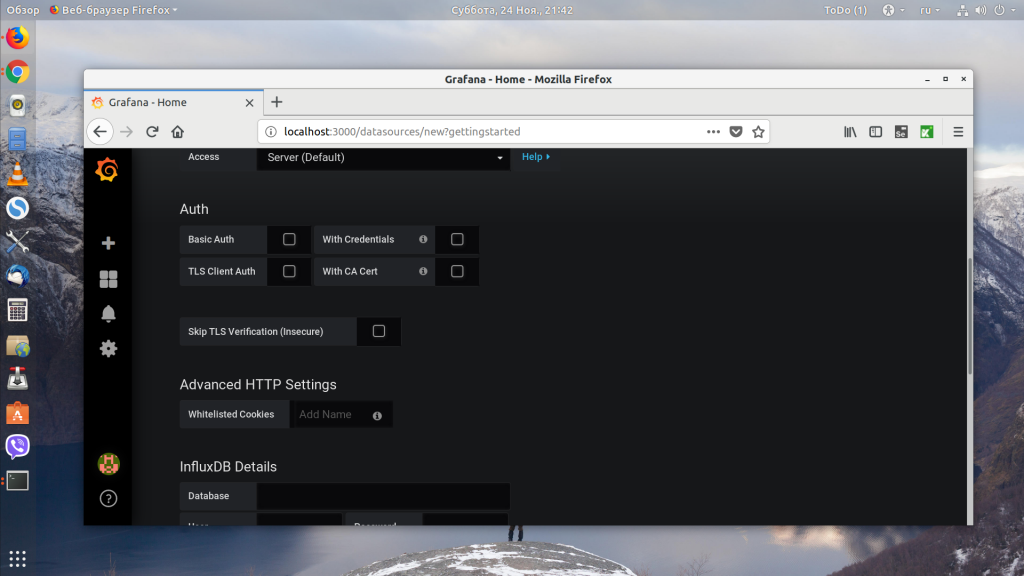
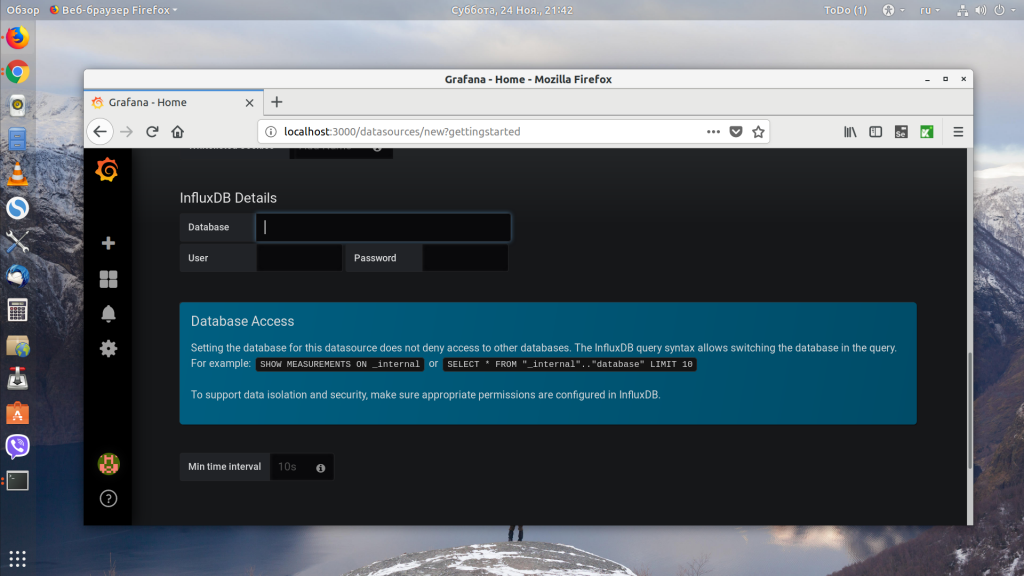
Если база данных закрыта с помощью http-аутентификации, то ниже надо указать для неё данные. В самом низу нужно указать имя базы данных пользователя и его пароль для доступа к ней:
Затем нажмите кнопку Save. Если всё прошло успешно, то вы увидите сообщение, что источник успешно добавлен.
3. Создание Dashboards Grafana
Вернитесь на домашнюю страницу и нажмите кнопку New dashboard:
Доска создана. Теперь нам нужно заполнить её виджетами.
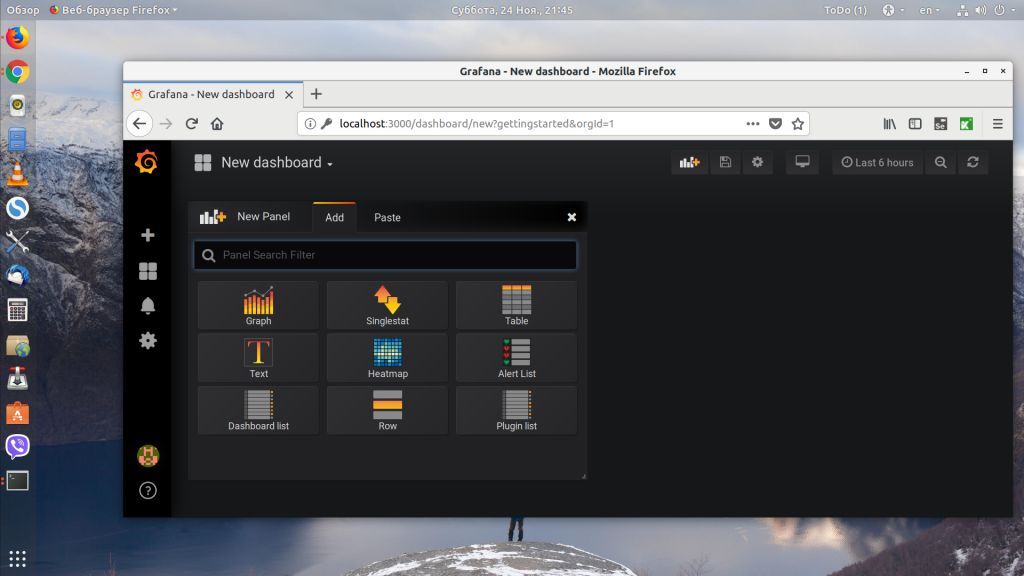
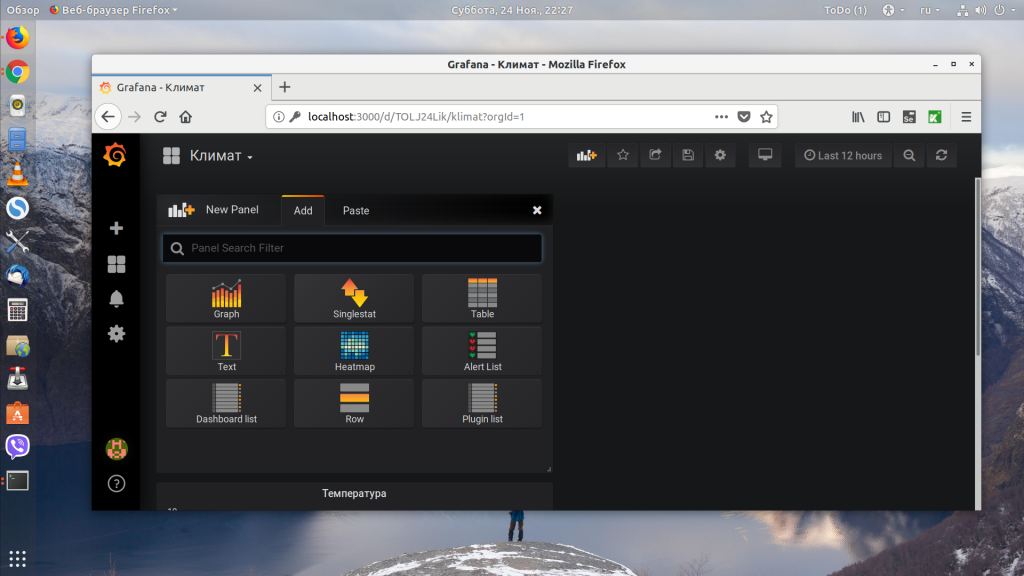
Сейчас доступно 9 разных виджетов:
- Graph — график;
- SingleStat — одиночный показатель;
- Table — таблица;
- Hteatmap — тепловая карта;
- Text — обычный текст;
- Row — разделитель, позволяющий создавать группы виджетов;
- Dashboards List — список доступных досок;
- Plugins List — список плагинов;
- Alerts List — список предупреждений;
Полезны нам для вывода информации только первые четыре, остальные используются для организации пространства или вывода меню программы. Давайте сначала создадим график.
4. Настройка графиков Grafana
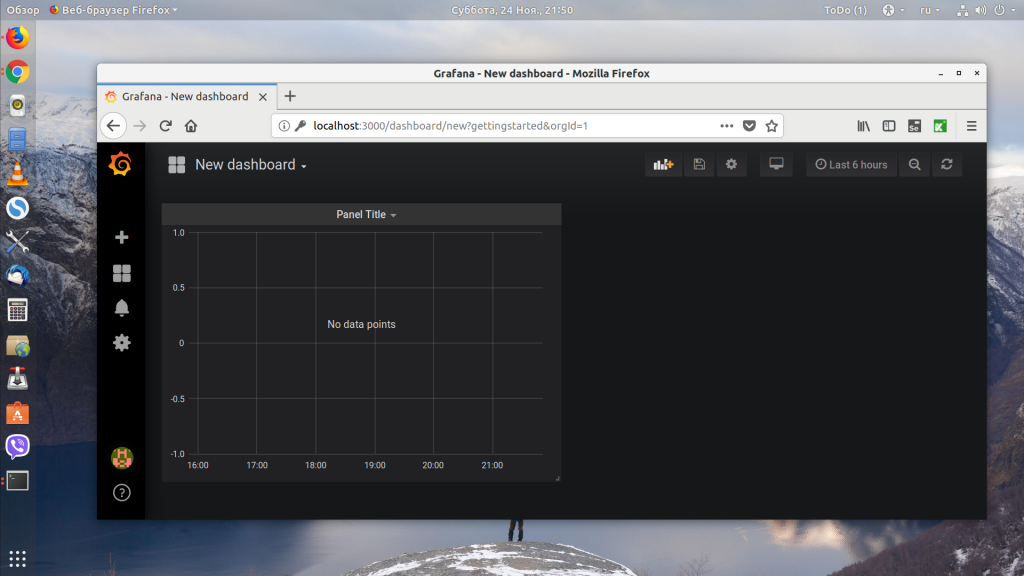
Теперь разберём, как выполняется настройка графиков Grafana. Как вы догадались, для создания графика нужно нажать на кнопку Graph. После этого пустой график будет добавлен в рабочую область панели:
Нажмите на стрелочку около его заголовка и выберите в открывшемся меню Edit:

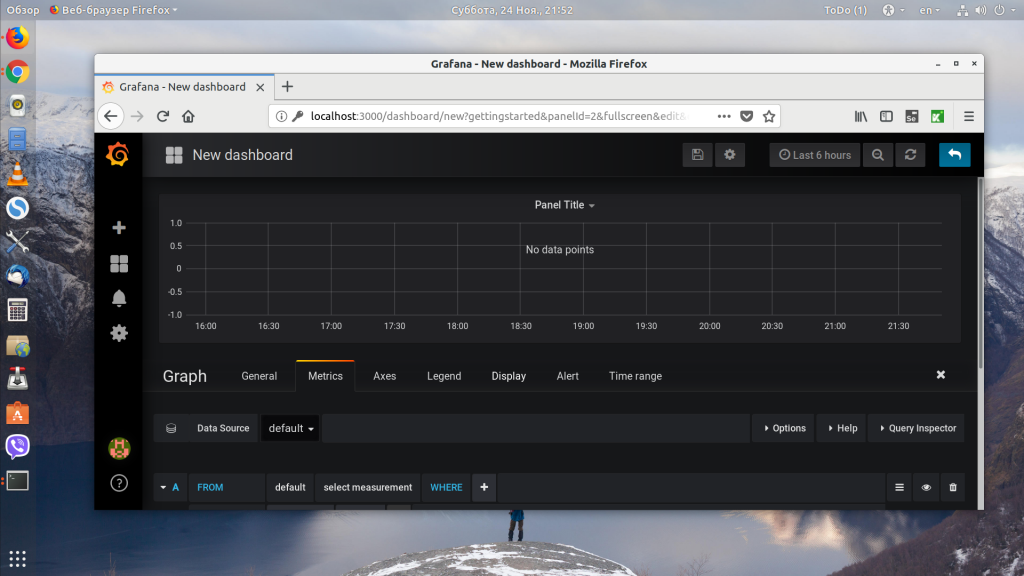
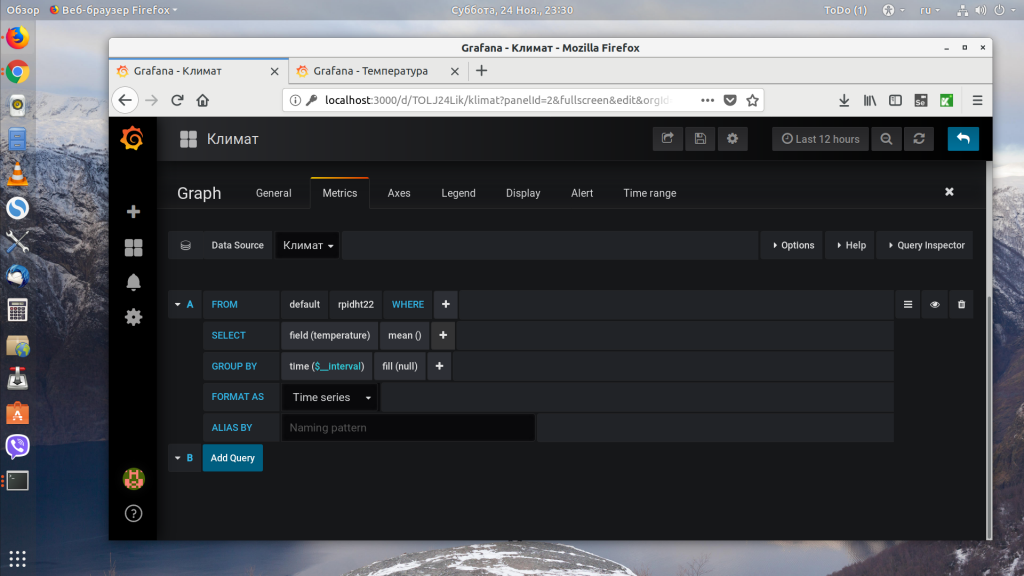
Рассмотрим содержимое интерфейса настройки более подробно:
- Шапка — содержит кнопки: сохранить, поделиться, меню для выбора периода времени, за который будут браться данные, кнопку изменения интервала времени, кнопку обновления данных и кнопку возврата;
- График — размещён под шапкой, показывает, как будет выглядеть ваш график;
- Панель вкладок — позволяет переключаться между разными вкладками настроек;
- Настройки — под панелью вкладок находятся настройки запроса к базе данных на получение данных;
Эти настройки можно разделить на несколько пунктов:
- Data Source — источник данных;
- FROM — таблица в базе данных или индекс;
- WHERE — условие отбора;
- SELECT — поле которые надо выбрать;
- GROUP BY — группировка значений.
В нашем примере у меня есть база с климатическими данными за определённый период, температурой и влажностью. В ней есть таблица rpi-dht22, в которой есть поля: time, humidity, temperature и location. Структура документа influxdb:
{

"measurement": rpidht22,

"tags": {

"location": indor/outdor,

},

"time": ГГГГ-ММ-ДДTчч:мм:ссZ,

"fields": {

"temperature" : температура,

"humidity": влажность

}

}
Обратите внимание, если вы хотите, чтобы InfluxDB могла нормально работать с временем, нужно, чтобы оно было в правильном формате. Правильный формат — это ГГГГ-ММ-ДДTчч:мм:ссZ, где T и Z ни на что не заменяются. Если время будет не в таком формате, то функции группровки по времени могут не работать.
В качестве источника выбираем ранее созданный источник Климат, таблица — rpidht22, а поле temperature. Когда вы будете открывать каждый из пунктов, программа предложит вам выбрать одно из доступных значений. Это очень удобно:
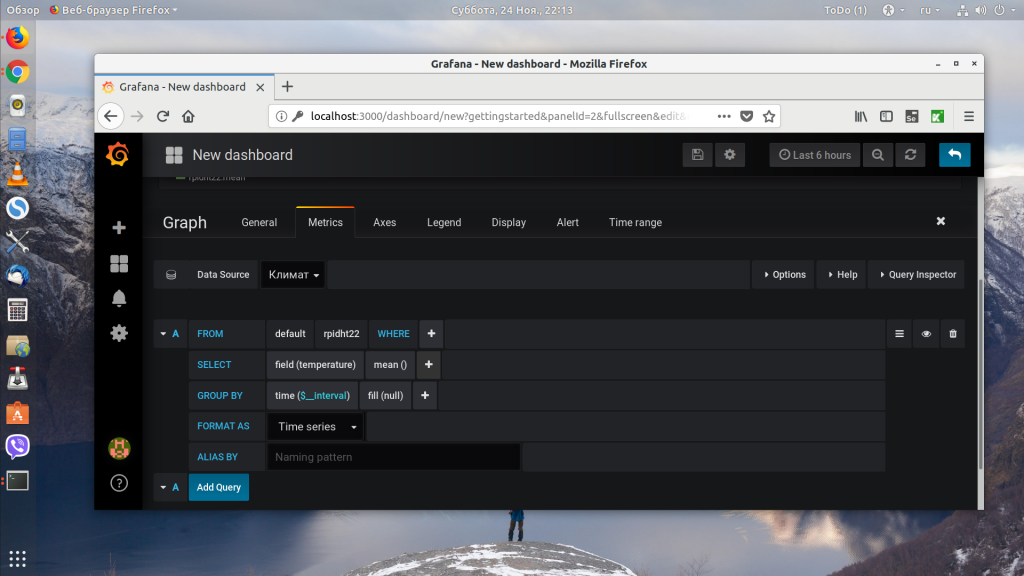
Если в базе есть данные, то они уже должны начать отображаться. Если не отображаются, попробуйте добавить больше данных или измените период или интервал времени:

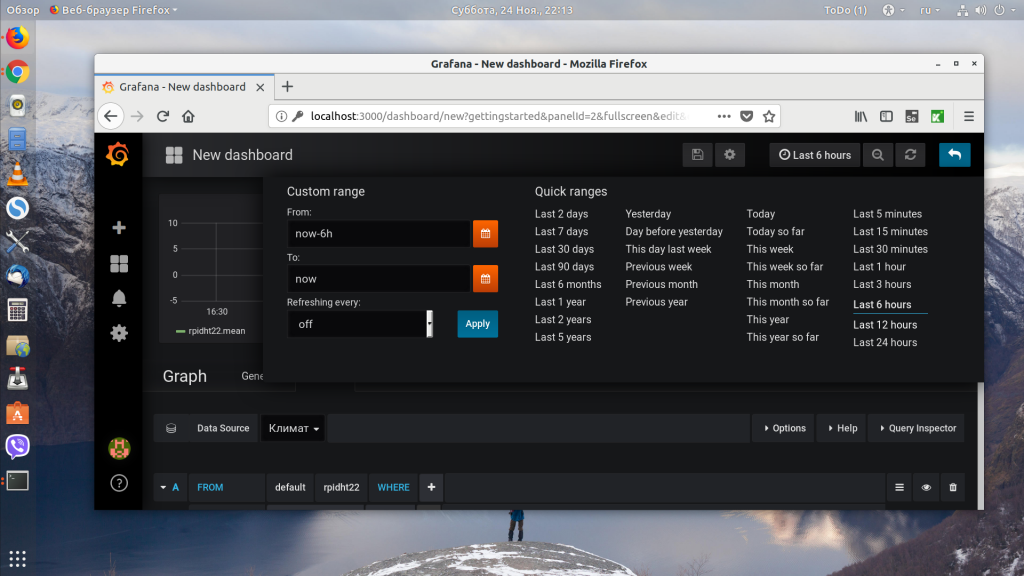
Если всё ещё что-то не работает, вы можете нажать кнопку Query Inspector на панели вкладок и посмотреть запрос, который используется для получения данных, его можно потом выполнить отдельно в интерфейсе базы данных, поэкспериментировать и понять, что не работает.
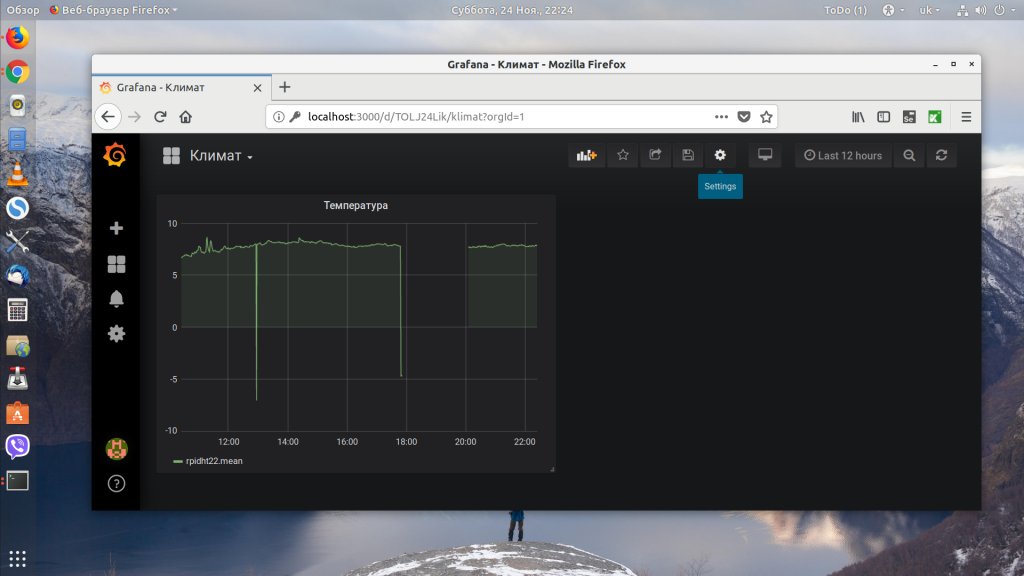
Сейчас мы на вкладке Metrics. Переключившись на вкладку General мы можем настроить имя графика в поле Title:
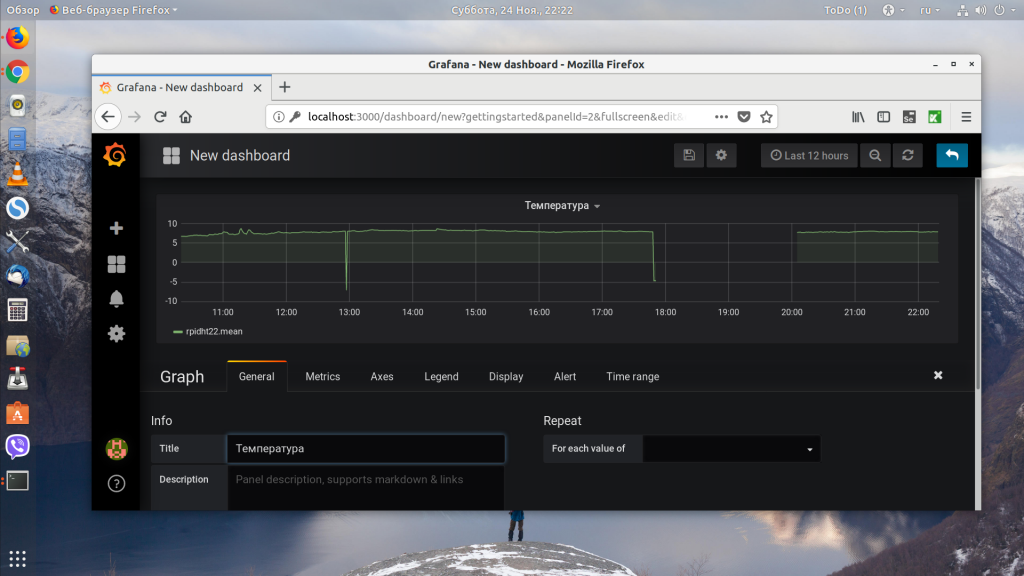
Сохранив график, вы вернётесь к нашей панели и получите такой результат:
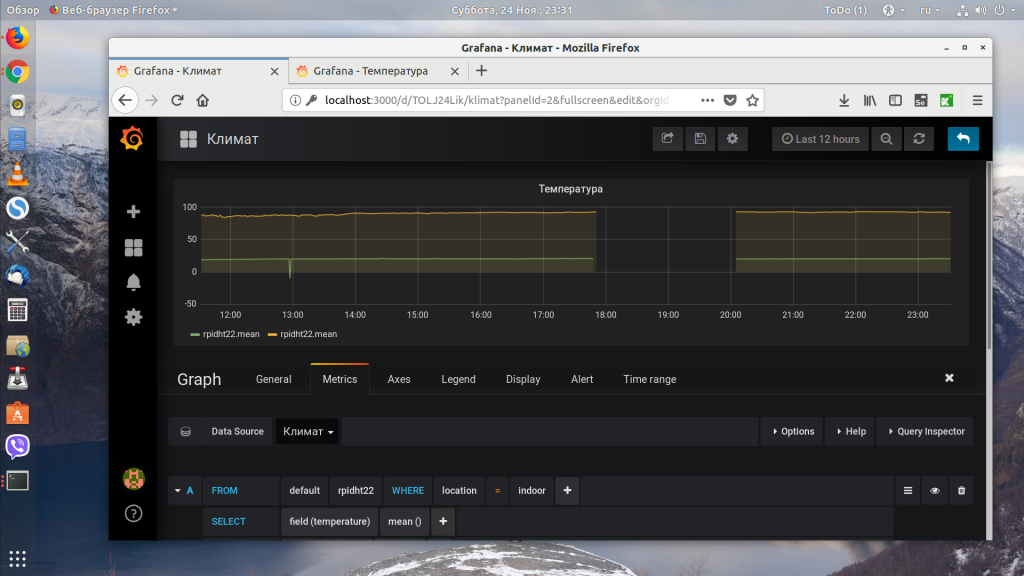
Вот такие графики Grafana можно получить. Если добавить несколько полей данных для графика с помощью кнопки Add Query:
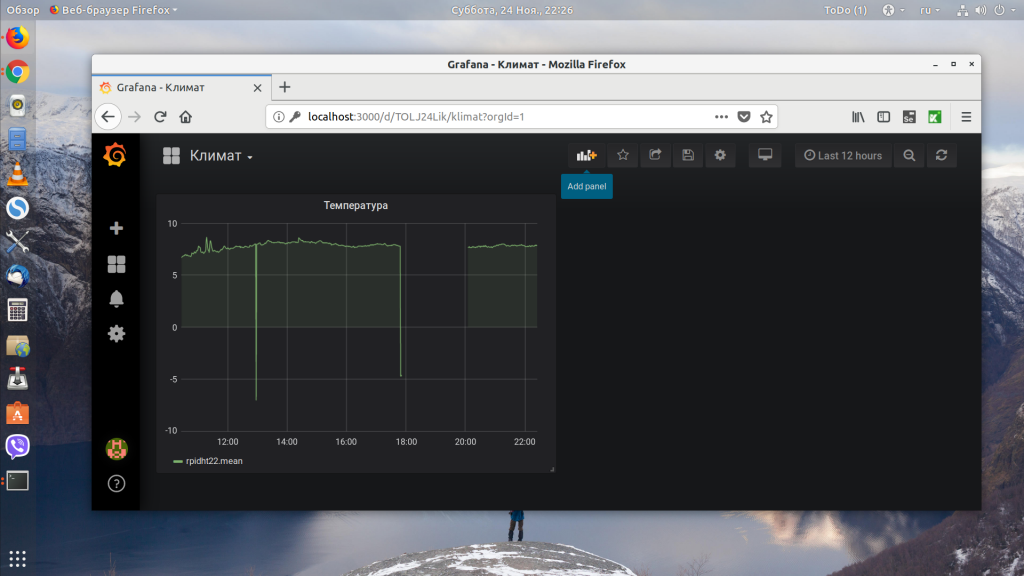
То на одном полотне будет отображаться два графика:
5. Создание SingleStat
Виджет SingleStat позволяет отображать усреднённое значение показателя, а также шкалу и его текущую позицию на ней. Чтобы добавить новый элемент на панель, нажмите кнопку Add Panel:
Затем выберите пункт SingleStat:
Настройка источников данных выполняется точно также, как и для графика, только сюда можно добавить лишь один показатель.
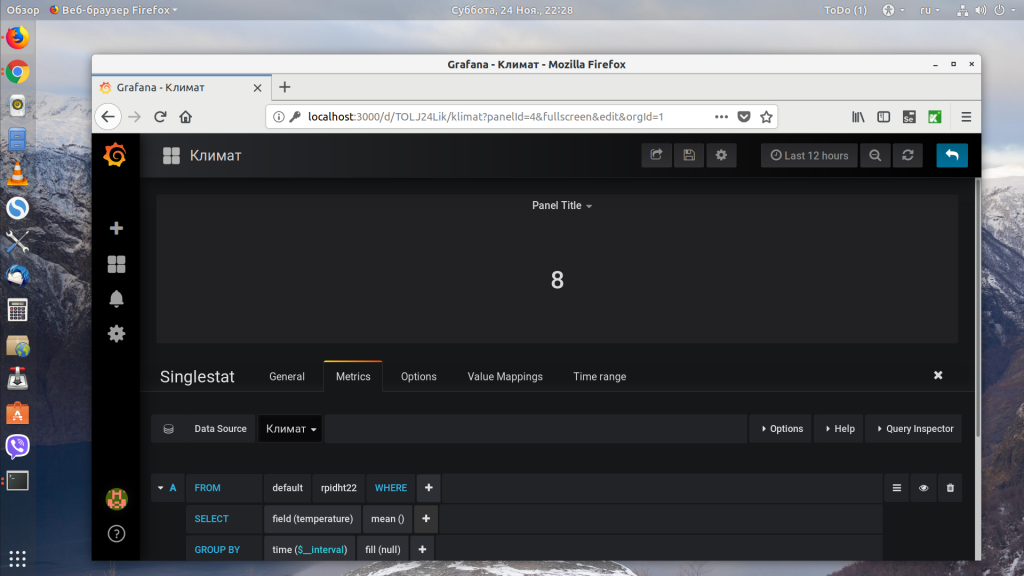
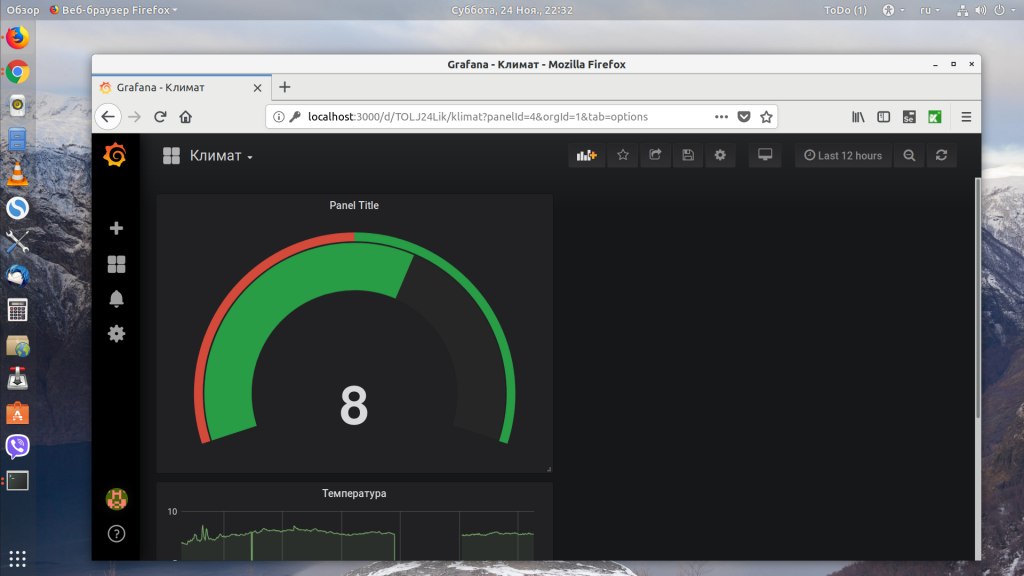
Особенность этого виджета в том, что он берёт все данные и применяет к ним определённую функцию, а затем выводит результат. По умолчанию применяется функция average. Я хочу знать текущую температуру, для этого мне надо получить последнее значение из списка, а не среднее. Функцию обработки данных можно изменить на вкладке Options. Для последнего значения выберите в поле Stat значение Current:
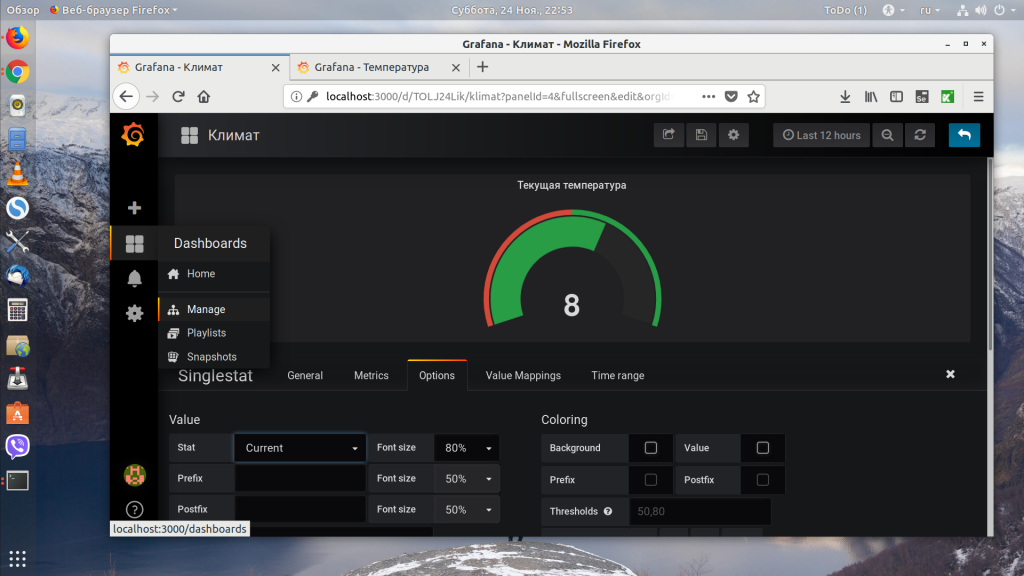
Чтобы включить отображение шкалы, найдите на вкладке Options пункт Guage и поставьте напротив него галочку. Здесь же можно указать максимальное и минимальное значение:
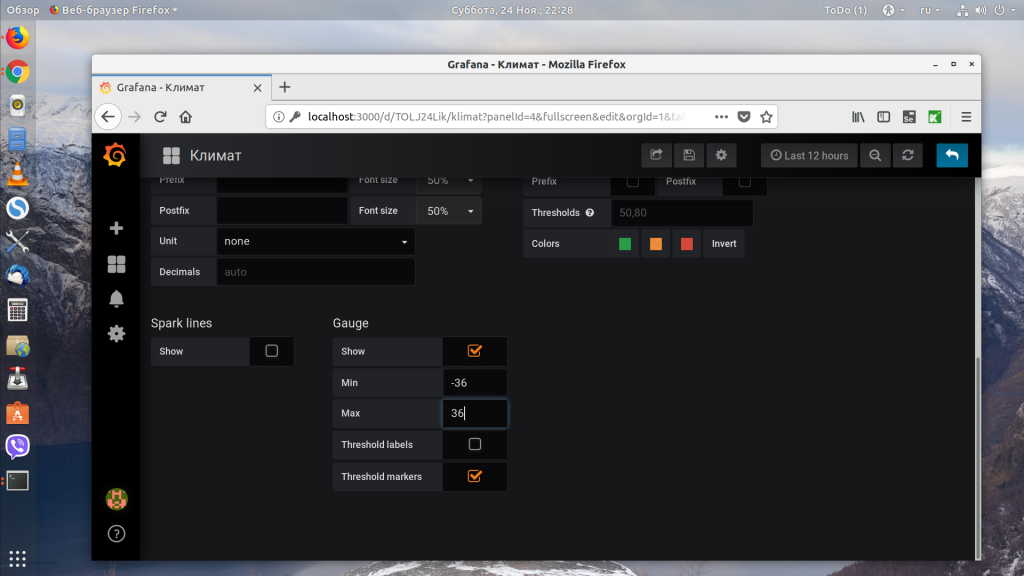
Вот такая панель получится в результате:
6. Настройка панели
Имя панели вы можете задать, нажав на кнопку с шестерёнкой. Затем введите нужное имя в поле Name:
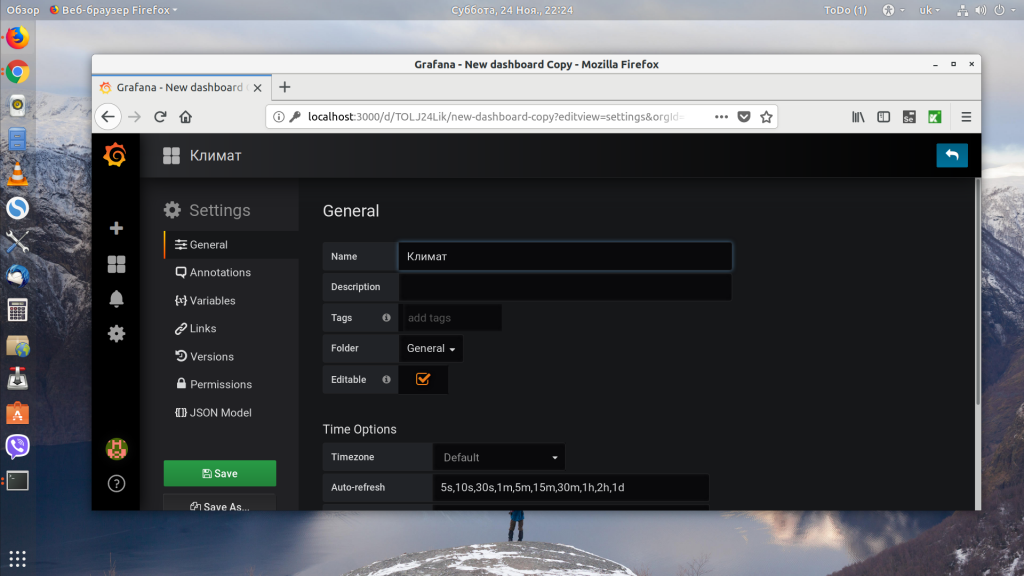
Как вы, возможно, уже заметили, взявшись за нижний правый угол можно менять размеры виджетов, а за заголовок — перетягивать их в другое место. Добавив несколько виджетов и разделив температуру с помощью условия WHERE на улицу и дом, получаем такую панель:
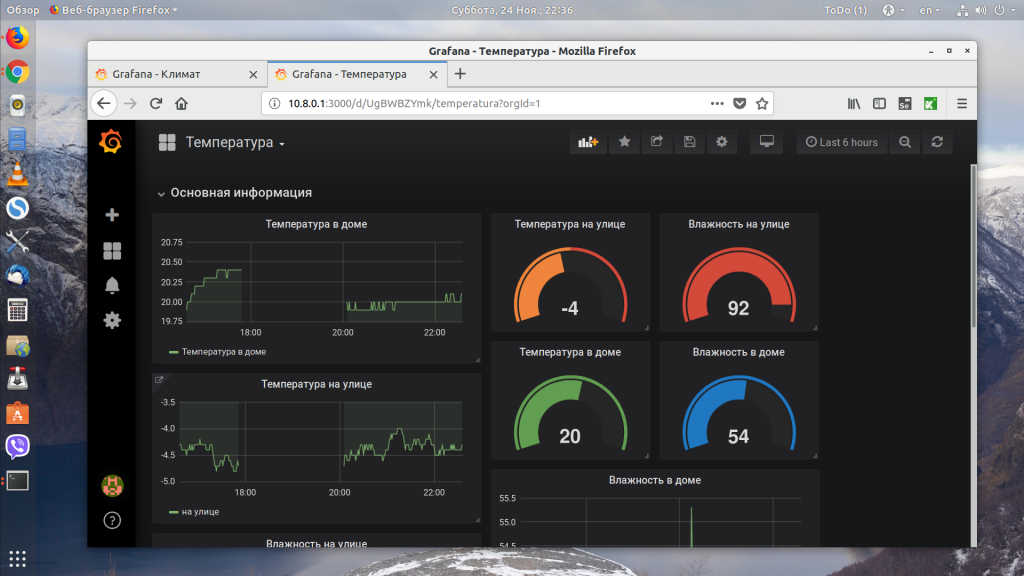
Таблица и тепловая карта выглядят вот так:
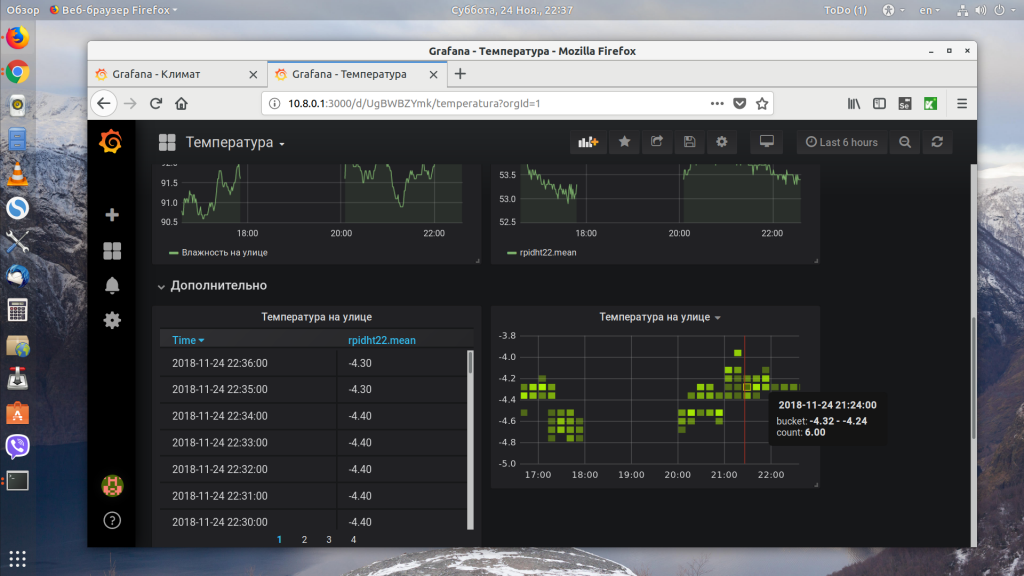
После внесения изменений не забывайте сохранить панель.
7. Импорт и экспорт
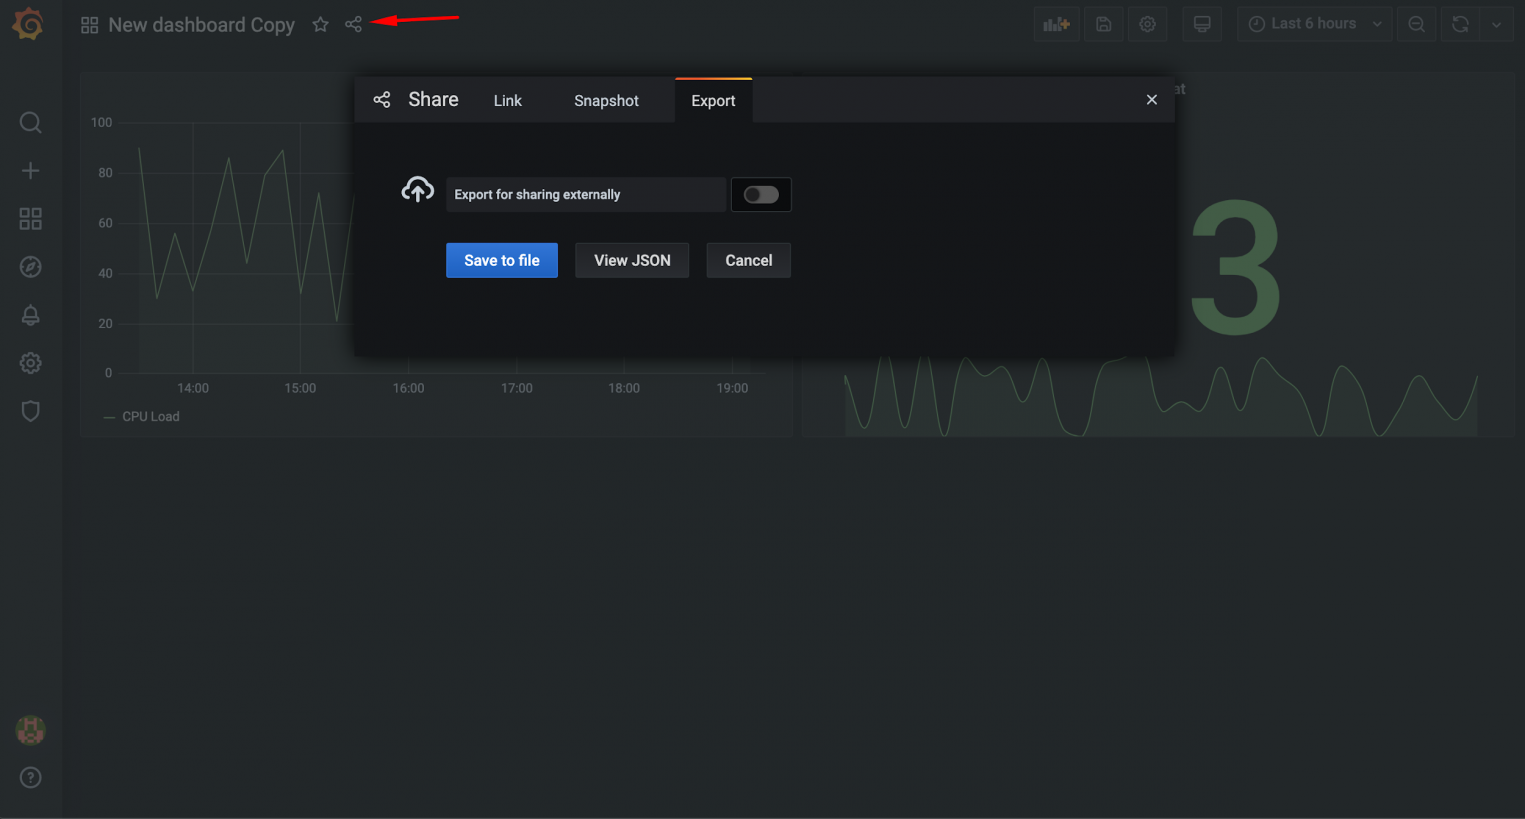
Готовую панель можно экспортировать и импортировать на другом сервере. Для этого есть кнопка Share:
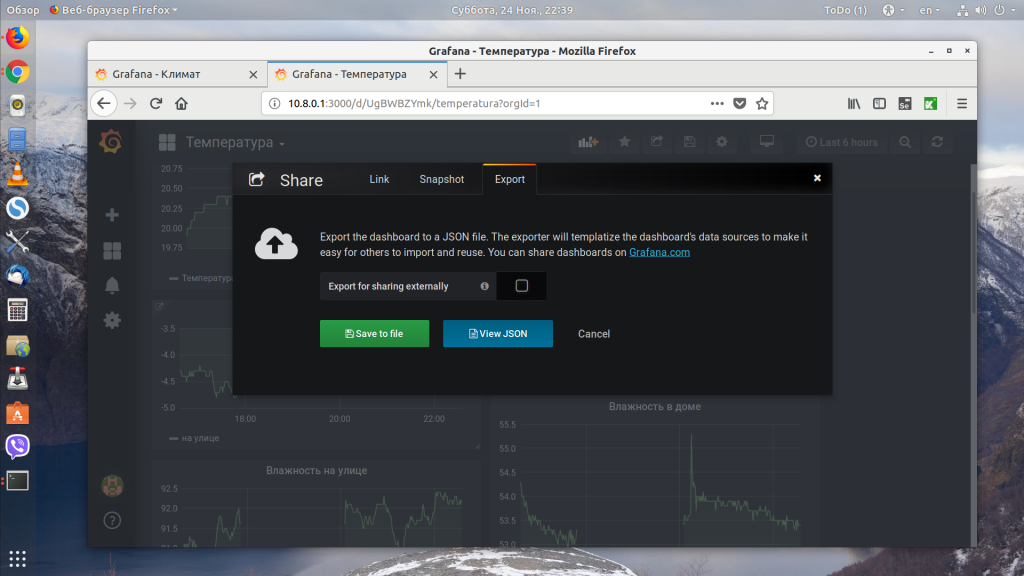
Здесь перейдите на вкладку Export и нажмите кнопку Save to file. Теперь полученный файл вы можете использовать для импорта на другой машине. Для этого выберите в меню Dashboard -> Manage:
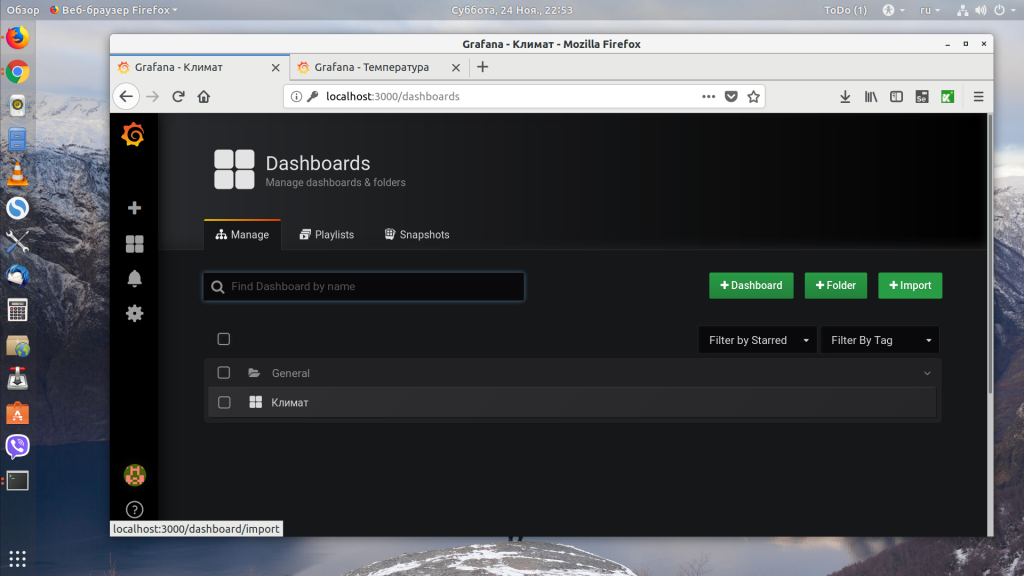
В открывшемся окне нажмите кнопку Import, теперь осталось выбрать файл и выбрать источник, откуда будут браться данные.
Выводы
Grafana — это очень мощная система построения графиков и мониторинга статистики. У неё много функций и их невозможно охватить одной статьей, я рассказал только про работу с InfluxDB и построение простых графиков, но этого будет вполне достаточно, чтобы начать работу, а дальше вы уже разберётесь. А какие системы статистики используете вы? Почему? Напишите в комментариях!
Обнаружили ошибку в тексте? Сообщите мне об этом. Выделите текст с ошибкой и нажмите Ctrl+Enter.

Статья распространяется под лицензией Creative Commons ShareAlike 4.0 при копировании материала ссылка на источник обязательна .