- Manuals
- Brands
- Agilent Technologies Manuals
- Measuring Instruments
- N9010A
Manuals and User Guides for Agilent Technologies N9010A. We have 3 Agilent Technologies N9010A manuals available for free PDF download: Manual, Configuration Manual
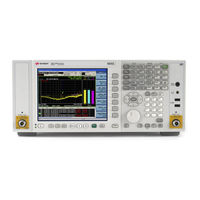
Agilent Technologies N9010A Manual (622 pages)
Signal Analyzer
Brand: Agilent Technologies
|
Category: Measuring Instruments
|
Size: 4.94 MB
Table of Contents
-
Table of Contents
5
-
Using Help
41
-
Locating Other Help Resources
42
-
Viewing Help on a Separate Computer
43
-
Copying the HTML Help (CHM) Files
43
-
Copying the Acrobat (PDF) Files
44
-
How Help Is Organized
46
-
Help Contents Listing
46
-
System Functions
47
-
Key Descriptions for each Measurement
47
-
Key Information for Softkeys
48
-
Common Measurement Functions
48
-
Front Panel Keys Used by the Help System
49
-
Navigating Windows HTML Help (CHM) Files
50
-
HTML Help Window Components
50
-
Basic Help Window Operations
51
-
Navigating the Help Window
53
-
Navigating Acrobat (PDF) Files
59
-
Adobe Reader Window
59
-
Printing Acrobat Files
60
-
Terms Used in this Documentation
62
-
Terms Used in Key Parameter Tables
62
-
Context Sensitive Help Not Available
64
-
Finding a Topic Without a Mouse and Keyboard
64
-
Selecting a Hyperlink Without a Mouse
65
-
About the Instrument
67
-
Installing Application Software
68
-
Viewing a License Key
68
-
Obtaining and Installing a License Key
68
-
Missing and Old Measurement Application Software
69
-
X-Series Options and Accessories
70
-
Front-Panel Features
71
-
Overview of Key Types
75
-
Display Annotations
78
-
Rear-Panel Features
80
-
Window Control Keys
84
-
Multi-Window
84
-
Zoom
84
-
Next Window
85
-
Mouse and Keyboard Control
87
-
Right-Click
87
-
PC Keyboard
89
-
Instrument Security & Memory Volatility
92
-
About the IQ Analyzer Measurement Application
93
-
Using the Electronic Attenuator Hardware
94
-
(Option EA3)
94
-
Using the Wideband Analysis Hardware
95
-
(Option B25 for MXA and EXA)
95
-
Programming the Analyzer
97
-
What Programming Information Is Available
98
-
IEEE Common GPIB Commands
99
-
Calibration Query
99
-
Clear Status
99
-
Standard Event Status Enable
99
-
Standard Event Status Register Query
100
-
Identification Query
100
-
Instrument Model Number
101
-
Operation Complete
101
-
Query Instrument Options
101
-
Recall Instrument State
102
-
Save Instrument State
102
-
Service Request Enable
103
-
Status Byte Query
103
-
Trigger
103
-
Self Test Query
104
-
Wait-To-Continue
104
-
System Functions
105
-
File
106
-
File Explorer
106
-
Page Setup
107
-
Print
108
-
Maximize/Restore down
108
-
Minimize
109
-
Exit
109
-
Mode Preset
110
-
Restore Mode Defaults
112
-
RST (Remote Command Only)
112
-
Print
113
-
Quick Save
114
-
Recall
116
-
State
116
-
Trace (+State)
120
-
Data (Import)
123
-
File Open Dialog and Menu
124
-
Save
128
-
State
128
-
Trace (+State)
131
-
Data (Export)
135
-
Screen Image
137
-
Save as
141
-
Mass Storage Catalog (Remote Command Only)
144
-
Mass Storage Change Directory (Remote Command Only)
144
-
Mass Storage Copy (Remote Command Only)
145
-
Mass Storage Delete (Remote Command Only)
145
-
Mass Storage Data (Remote Command Only)
145
-
Mass Storage Make Directory (Remote Command Only)
146
-
Mass Storage Move (Remote Command Only)
146
-
Mass Storage Remove Directory (Remote Command Only)
146
-
System
147
-
Show
147
-
Power on
152
-
Alignments
160
-
I/O Config
187
-
Restore Defaults
195
-
Control Panel
199
-
Licensing
200
-
Security
203
-
Diagnostics
204
-
Service
207
-
Internet Explorer
208
-
System Remote Commands (Remote Commands Only)
208
-
User Preset
211
-
User Preset All Modes
212
-
Save User Preset
213
-
Complex Spectrum Measurement
215
-
AMPTD y Scale
219
-
Ref Value
219
-
Attenuation
220
-
Range
220
-
Scale/DIV
221
-
Presel Center
222
-
Presel Adjust
222
-
Internal Preamp
223
-
Ref Position
223
-
Auto Scaling
224
-
Auto Couple
225
-
Res BW
226
-
Cont
227
-
FREQ Channel
228
-
Input/Output
229
-
Marker
230
-
Select Marker
230
-
Marker Type
230
-
Marker X Axis Value (Remote Command Only)
231
-
Marker X Axis Position (Remote Command Only)
231
-
Marker y Axis Value (Remote Command Only)
232
-
Properties
233
-
Couple Markers
234
-
All Markers off
235
-
Backward Compatibility SCPI Commands
235
-
Marker Function
236
-
Select Marker
236
-
Marker Function Type
236
-
Band Adjust
236
-
Marker to
239
-
Mkr -> CF
239
-
Mkr -> Ref Lvl
239
-
Meas
241
-
Meas Setup
242
-
Avg/Hold Num
242
-
Avg Mode
243
-
Avg Type
243
-
HW Averaging
244
-
Time Avg Num
244
-
Phnoise Opt
245
-
Advanced
247
-
Meas Preset
259
-
Mode
260
-
Mode Setup
261
-
Peak Search
262
-
Next Peak
262
-
Next Pk Right
262
-
Next Pk Left
263
-
Marker Delta
263
-
Min Search
263
-
Mkr->CF
264
-
Recall
265
-
Restart
266
-
Save
267
-
Single
268
-
Source
269
-
Span X Scale
270
-
Span (Spectrum View)
270
-
Ref Value (Waveform View)
271
-
Scale/DIV (Waveform View)
272
-
Ref Position (Waveform View)
272
-
Auto Scaling (Waveform View)
273
-
Sweep/Control
274
-
Pause/Resume
274
-
Trace/Detector
275
-
Trigger
276
-
View/Display
277
-
Measurement Results View
277
-
Display
278
-
Waveform Measurement
279
-
AMPTD y Scale
281
-
Ref Value
281
-
Attenuation
282
-
Range
283
-
Scale/DIV
283
-
Presel Center
284
-
Presel Adjust
285
-
Internal Preamp
285
-
Ref Position
285
-
Auto Scaling
287
-
Auto Couple
288
-
Digital if BW
289
-
Filter Type
290
-
Filter Type Bwcc
291
-
Filter BW
299
-
Channel Filter Bandwidth Bwcc (Remote Command Only)
300
-
Filter Alpha
300
-
Cont
302
-
FREQ Channel
303
-
Input/Output
304
-
Marker
305
-
Select Marker
305
-
Marker Type
305
-
Marker X Axis Value (Remote Command Only)
306
-
Marker X Axis Position (Remote Command Only)
307
-
Marker y Axis Value (Remote Command Only)
308
-
Properties
308
-
Couple Markers
310
-
All Markers off
311
-
Backward Compatibility SCPI Commands
311
-
Marker Function
312
-
Select Marker
312
-
Marker Function Type
312
-
Band Adjust
313
-
Marker to
316
-
Meas
317
-
Meas Setup
318
-
Average/Hold Num
318
-
Avg Mode
319
-
Avg Type
319
-
HW Averaging
320
-
Time Avg Num
320
-
Sample Rate
321
-
Sample Period (Aperture) Setting (Remote Command Only)
321
-
Meas Time
322
-
Phnoise Opt
322
-
Advanced
325
-
Meas Preset
329
-
Mode
330
-
Mode Setup
331
-
Peak Search
332
-
Next Peak
332
-
Min Search
332
-
Recall
334
-
Restart
335
-
Save
336
-
Single
337
-
Source
338
-
Span X Scale
339
-
Ref Value
339
-
Scale/DIV
339
-
Ref Position
340
-
Auto Scaling
341
-
Sweep/Control
342
-
Pause and Resume
342
-
Trace/Detector
343
-
Trigger
344
-
View/Display
345
-
Display
346
-
RF Envelope
347
-
I/Q Waveform
348
-
Common Measurement Functions
349
-
AMPTD y Scale
351
-
Reference Level
351
-
Attenuation
352
-
Range
361
-
Scale / DIV
366
-
Scale Type
367
-
Presel Center
368
-
Preselector Adjust
369
-
Y Axis Unit
371
-
Reference Level Offset
376
-
Μw Path Control
377
-
Μw Preselector Bypass
381
-
Internal Preamp
381
-
Auto Couple
385
-
Cont (Continuous Measurement/Sweep)
387
-
FREQ Channel
389
-
Center Frequency
389
-
Input/Output
393
-
RF Input
394
-
External Mixer
399
-
I/Q
413
-
RF Calibrator
429
-
External Gain
431
-
Restore Input/Output Defaults
436
-
Data Source
436
-
Corrections
441
-
Freq Ref in
452
-
Output Config
457
-
I/Q Guided Calibration
470
-
Meas
483
-
Remote Measurement Functions
483
-
Mode
497
-
Application Mode Number Selection (Remote Command Only)
499
-
Application Mode Catalog Query (Remote Command Only)
500
-
Application Identification (Remote Commands Only)
501
-
Application Identification Catalog (Remote Commands Only)
502
-
Detailed List of Modes
504
-
Global Settings
514
-
Global Center Freq
514
-
Restore Defaults
515
-
Mode Setup
517
-
IF Path
517
-
IF Path Auto
518
-
Restore Mode Defaults
519
-
Recall
521
-
Amplitude Correction
521
-
Restart
525
-
Save
527
-
Amplitude Correction
527
-
Single (Single Measurement/Sweep)
531
-
Source
533
-
Sweep/Control
535
-
Sweep Time
535
-
Sweep Setup
537
-
Pause/Resume
547
-
Gate
548
-
Points
561
-
Zoom Points
562
-
Abort (Remote Command Only)
563
-
Trace/Detector
565
-
Trigger
567
-
Free Run
576
-
Video (if Envelope)
576
-
Line
579
-
External 1
581
-
External 2
584
-
RF Burst
586
-
Periodic Timer (Frame Trigger)
591
-
Baseband I/Q
598
-
Auto/Holdoff
609
-
Trigger Offset (Remote Command Only)
611
-
View/Display
613
-
Display
613
-
Full Screen
621
-
Display Enable (Remote Command Only)
622
Advertisement
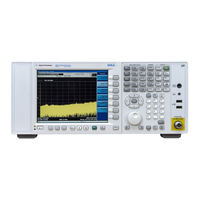
Agilent Technologies N9010A Manual (107 pages)
Signal Analyzer TD-SCDMA with HSPA/8PSK Measurement Application Measurement Guide
Brand: Agilent Technologies
|
Category: Measuring Instruments
|
Size: 2.54 MB
Agilent Technologies N9010A Configuration Manual (16 pages)
EXA Signal Analyzer
Brand: Agilent Technologies
|
Category: Measuring Instruments
|
Size: 0.55 MB
Advertisement
Advertisement
Related Products
-
Agilent Technologies N9030A
-
Agilent Technologies N9020A
-
Agilent Technologies N9079A
-
Agilent Technologies N9000A
-
Agilent Technologies N9010AK-REA
-
Agilent Technologies N9020AK-REA
-
Agilent Technologies N9030AK-REA
-
Agilent Technologies FieldFox N9928A
-
Agilent Technologies FieldFox N9936A
-
Agilent Technologies FieldFox N9917A
Agilent Technologies Categories
Measuring Instruments
Laboratory Equipment
Test Equipment
Water Pump
![]()
Power Supply
More Agilent Technologies Manuals
Краткое содержание страницы № 1
Agilent X-Series
Signal Analyzer
This manual provides documentation for the
following X-Series Analyzer:
EXA Signal Analyzer N9010A
N9010A EXA Specifications
Guide
(Comprehensive Reference Data)
Краткое содержание страницы № 2
Notices © Agilent Technologies, Inc. 2007 — 2010 licensed as “Commercial computer soft- Manual Part Number ware” as defined in DFAR 252.227-7014 No part of this manual may be reproduced N9010-90025 (June 1995), or as a “commercial item” as in any form or by any means (including Supersedes: August 2009 defined in FAR 2.101(a) or as “Restricted electronic storage and retrieval or transla- computer software” as defined in FAR tion into a foreign language) without prior 52.227-19 (June 1987
Краткое содержание страницы № 3
Notice Warranty This Agilent technologies instrument product is warranted against defects in material and workmanship for a period of one year from the date of shipment. During the warranty period, Agilent Technologies will, at its option, either repair or replace products that prove to be defective. For warranty service or repair, this product must be returned to a service facility designated by Agilent Technologies. Buyer shall prepay shipping charges to Agilent Technologies and Agilent Tec
Краткое содержание страницы № 4
4
Краткое содержание страницы № 5
Contents 1. Agilent EXA Signal Analyzer Definitions and Requirements . . . . . . . . . . . . . . . . . . . . . . . . . . . . . . . . . . . . . . . . . . . . . . . . . . . . . . . . . . . 14 Definitions. . . . . . . . . . . . . . . . . . . . . . . . . . . . . . . . . . . . . . . . . . . . . . . . . . . . . . . . . . . . . . . . . . . . . . . . . 14 Conditions Required to Meet Specifications. . . . . . . . . . . . . . . . . . . . . . . . . . . . . . . . . . . . . . . . . . . . . . . 14 Certificati
Краткое содержание страницы № 6
Contents Power Suite Measurements . . . . . . . . . . . . . . . . . . . . . . . . . . . . . . . . . . . . . . . . . . . . . . . . . . . . . . . . . . . . . 56 Channel Power . . . . . . . . . . . . . . . . . . . . . . . . . . . . . . . . . . . . . . . . . . . . . . . . . . . . . . . . . . . . . . . . . . . . . 56 Occupied Bandwidth. . . . . . . . . . . . . . . . . . . . . . . . . . . . . . . . . . . . . . . . . . . . . . . . . . . . . . . . . . . . . . . . . 56 Adjacent Channel Power (ACP) . . .
Краткое содержание страницы № 7
Contents 5. Option PFR — Precision Frequency Reference Specifications Affected by Precision Frequency Reference. . . . . . . . . . . . . . . . . . . . . . . . . . . . . . . . . . . . 100 6. I/Q Analyzer Specifications Affected by I/Q Analyzer:. . . . . . . . . . . . . . . . . . . . . . . . . . . . . . . . . . . . . . . . . . . . . . . . . . 102 Frequency . . . . . . . . . . . . . . . . . . . . . . . . . . . . . . . . . . . . . . . . . . . . . . . . . . . . . . . . . . . . . . . . . . . . . . . .
Краткое содержание страницы № 8
Contents (EVM). . . . . . . . . . . . . . . . . . . . . . . . . . . . . . . . . . . . . . . . . . . . . . . . . . . . . . . . . . . . . . . . . . . . . . . . . . . 136 Power vs. Time . . . . . . . . . . . . . . . . . . . . . . . . . . . . . . . . . . . . . . . . . . . . . . . . . . . . . . . . . . . . . . . . . . . . 137 EDGE Power vs. Time . . . . . . . . . . . . . . . . . . . . . . . . . . . . . . . . . . . . . . . . . . . . . . . . . . . . . . . . . . . . . . 137 Power Ramp Relative Accuracy
Краткое содержание страницы № 9
Contents AM Rejection . . . . . . . . . . . . . . . . . . . . . . . . . . . . . . . . . . . . . . . . . . . . . . . . . . . . . . . . . . . . . . . . . . . . . 152 Residual PM . . . . . . . . . . . . . . . . . . . . . . . . . . . . . . . . . . . . . . . . . . . . . . . . . . . . . . . . . . . . . . . . . . . . . . 152 Measurement Range . . . . . . . . . . . . . . . . . . . . . . . . . . . . . . . . . . . . . . . . . . . . . . . . . . . . . . . . . . . . . . . . 152 12. Noise Figure Measurement A
Краткое содержание страницы № 10
Contents Occupied Bandwidth. . . . . . . . . . . . . . . . . . . . . . . . . . . . . . . . . . . . . . . . . . . . . . . . . . . . . . . . . . . . . . . . 182 Spectrum Emission Mask . . . . . . . . . . . . . . . . . . . . . . . . . . . . . . . . . . . . . . . . . . . . . . . . . . . . . . . . . . . . 183 Spurious Emissions. . . . . . . . . . . . . . . . . . . . . . . . . . . . . . . . . . . . . . . . . . . . . . . . . . . . . . . . . . . . . . . . . 184 Code Domain . . . . . . . . . . . . . . .
Краткое содержание страницы № 11
Contents 20. DVB-T/H Measurement Application N6153A, DVB-T/H Measurements Application . . . . . . . . . . . . . . . . . . . . . . . . . . . . . . . . . . . . . . . . . . . . 218 Channel Power . . . . . . . . . . . . . . . . . . . . . . . . . . . . . . . . . . . . . . . . . . . . . . . . . . . . . . . . . . . . . . . . . . . . 218 Channel Power with Shoulder Attenuation View . . . . . . . . . . . . . . . . . . . . . . . . . . . . . . . . . . . . . . . . . . 218 Power Statistics CCDF . . . . . . .
Краткое содержание страницы № 12
Contents Frequency Points per Span . . . . . . . . . . . . . . . . . . . . . . . . . . . . . . . . . . . . . . . . . . . . . . . . . . . . . . . . . . . 248 Resolution Bandwidth (RBW) . . . . . . . . . . . . . . . . . . . . . . . . . . . . . . . . . . . . . . . . . . . . . . . . . . . . . . . . 248 Input . . . . . . . . . . . . . . . . . . . . . . . . . . . . . . . . . . . . . . . . . . . . . . . . . . . . . . . . . . . . . . . . . . . . . . . . . . . . 249 Range . . . . . . . . . . . . . . . .
Краткое содержание страницы № 13
1 Agilent EXA Signal Analyzer This chapter contains the specifications for the core signal analyzer. The specifications and characteristics for the measurement applications and options are covered in the chapters that follow. 13
Краткое содержание страницы № 14
Agilent EXA Signal Analyzer Definitions and Requirements Definitions and Requirements This book contains signal analyzer specifications and supplemental information. The distinction among specifications, typical performance, and nominal values are described as follows. Definitions • Specifications describe the performance of parameters covered by the product warranty (temperature = 5 to 50°C, unless otherwise noted). • 95th percentile values indicate the breadth of the population (≈2σ) of perf
Краткое содержание страницы № 15
Agilent EXA Signal Analyzer Frequency and Time Frequency and Time Description Specifications Supplemental Information Frequency Range Maximum Frequency Option 503 3.6 GHz Option 507 7 GHz Option 513 13.6 GHz Option 526 26.5 GHz Preamp Option P03 3.6 GHz Minimum Frequency Preamp AC Coupled DC Coupled Off 10 MHz 9 kHz On 10 MHz 100 kHz b Band Harmonic Mixing LO Multiple (N ) Mode a Band Overlaps 0 (9 kHz to 3.6 GHz) 1 Options 503,507, 513, 526 1− 1 (3.5 GHz to 7 GHz) 1 Option 507 1−
Краткое содержание страницы № 16
Agilent EXA Signal Analyzer Frequency and Time a. In the band overlap regions, for example, 3.5 to 3.6 GHz, the analyzer may use either band for measurements, in this example Band 0 or Band 1. The analyzer gives preference to the band with the better overall specifications (which is the lower numbered band for all frequencies below 26 GHz), but will choose the other band if doing so is necessary to achieve a sweep having minimum band crossings. For example, with CF = 3.58 GHz, with a span of
Краткое содержание страницы № 17
Agilent EXA Signal Analyzer Frequency and Time Description Specifications Supplemental Information −6 Achievable Initial Calibration ±1.4 × 10 Accuracy −8 Settability ±2 × 10 c Residual FM ≤10 Hz × N p-p in 20 ms , nominal Center Frequency = 1 GHz 10 Hz RBW, 10 Hz VBW a. Calibration accuracy depends on how accurately the frequency standard was adjusted to 10 MHz. If the adjustment procedure is followed, the calibration accuracy is given by the specifi- cation “Achievable Initial
Краткое содержание страницы № 18
Agilent EXA Signal Analyzer Frequency and Time Description Specifications Supplemental Information Precision Frequency Reference (Option PFR) Accuracy ±[(time since last adjustment × aging rate) + temperature stability + calibration a b accuracy ] Temperature Stability −8 20 to 30 °C ±1.5 × 10 −8 5 to 50 °C ±5 × 10 −10 Aging Rate ±5 × 10 /day (nominal) Total Aging −7 1 Year ±1 × 10 −7 2 Years ±1.5 × 10 −9 Settability ±2 × 10 c Warm-up and Retrace −7 300 s after turn on
Краткое содержание страницы № 19
Agilent EXA Signal Analyzer Frequency and Time d. The achievable calibration accuracy at the beginning of the calibration cycle includes these effects: 1) Temperature difference between the calibration environment and the use environment 2) Orientation relative to the gravitation field changing between the calibration environment and the use environment 3) Retrace effects in both the calibration environment and the use environment due to turning the instrument power off. 4) Settability e.
Краткое содержание страницы № 20
Agilent EXA Signal Analyzer Frequency and Time Description Specifications Supplemental Information c Frequency Readout Accuracy ±(marker freq. × freq. ref. accy. + 0.25% Single detector only a × span + 5% × RBW + 2 Hz + 0.5 × b horizontal resolution ) d ±0.0032% (nominal) Example for EMC a. The warranted performance is only the sum of all errors under autocoupled conditions. Under non-autocoupled conditions, the frequency readout accuracy will nominally meet the specifica- tion equation, exc

Agilent X-Series
Signal Analyzer
N9010A EXA
Specifications Guide
(Comprehensive Reference Data)
This manual provides documentation for the
following X-Series Analyzer:
EXA Signal Analyzer N9010A
![]()
Agilent X-Series
Signal Analyzer
This manual provides documentation for the following X-Series Analyzer:
EXA Signal Analyzer N9010A
N9010A EXA
Specifications Guide
(Comprehensive Reference Data)

Notices
© Agilent Technologies, Inc. 2007 — 2013
No part of this manual may be reproduced in any form or by any means (including electronic storage and retrieval or translation into a foreign language) without prior agreement and written consent from Agilent Technologies, Inc. as governed by United States and international copyright laws.
Manual Part Number
N9010-90025
Supersedes: February 2013
Print Date
June 2013
Printed in USA
Agilent Technologies, Inc.
1400 Fountaingrove Parkway
Santa Rosa, CA 95403
Warranty
The material contained in this document is provided “as is,” and is subject to being changed, without notice, in future editions. Further, to the maximum extent permitted by applicable law, Agilent disclaims all warranties, either express or implied, with regard to this manual and any information contained herein, including but not limited to the implied warranties of merchantability and fitness for a particular purpose. Agilent shall not be liable for errors or for incidental or consequential damages in connection with the furnishing, use, or performance of this document or of any information contained herein. Should Agilent and the user have a separate written agreement with warranty terms covering the material in this document that conflict with these terms, the warranty terms in the separate agreement shall control.
Technology Licenses
The hardware and/or software described in this document are furnished under a license and may be used or copied only in accordance with the terms of such license.
Restricted Rights Legend
If software is for use in the performance of a U.S. Government prime contract or subcontract, Software is delivered and
licensed as “Commercial computer software” as defined in DFAR 252.227-7014 (June 1995), or as a “commercial item” as defined in FAR 2.101(a) or as “Restricted computer software” as defined in FAR 52.227-19 (June 1987) or any equivalent agency regulation or contract clause. Use, duplication or disclosure of Software is subject to Agilent Technologies’ standard commercial license terms, and non-DOD Departments and Agencies of the U.S. Government will receive no greater than Restricted Rights as defined in FAR 52.227-19(c)(1-2) (June 1987). U.S. Government users will receive no greater than Limited Rights as defined in FAR 52.22714 (June 1987) or DFAR 252.227-7015 (b)(2) (November 1995), as applicable in any technical data.
Safety Notices
CAUTION
A CAUTION notice denotes a hazard. It calls attention to an operating procedure, practice, or the like that, if not correctly performed or adhered to, could result in damage to the product or loss of important data. Do not proceed beyond a CAUTION notice until the indicated conditions are fully understood and met.
WARNING
A WARNING notice denotes a hazard. It calls attention to an operating procedure, practice, or the like that, if not correctly performed or adhered to, could result in personal injury or death. Do not proceed beyond a WARNING notice until the indicated conditions are fully understood and met.
2

Warranty
This Agilent technologies instrument product is warranted against defects in material and workmanship for a period of three years from the date of shipment. During the warranty period, Agilent Technologies will, at its option, either repair or replace products that prove to be defective.
For warranty service or repair, this product must be returned to a service facility designated by Agilent Technologies. Buyer shall prepay shipping charges to Agilent Technologies and Agilent Technologies shall pay shipping charges to return the product to Buyer. However, Buyer shall pay all shipping charges, duties, and taxes for products returned to Agilent Technologies from another country.
Where to Find the Latest Information
Documentation is updated periodically. For the latest information about this analyzer, including firmware upgrades, application information, and product information, see the following URLs:
http://www.agilent.com/find/exa
To receive the latest updates by email, subscribe to Agilent Email Updates:
http://www.agilent.com/find/emailupdates
Information on preventing analyzer damage can be found at:
http://www.agilent.com/find/tips
3

4

Contents
1. Agilent EXA Signal Analyzer
Definitions and Requirements . . . . . . . . . . . . . . . . . . . . . . . . . . . . . . . . . . . . . . . . . . . . . . . . . . . . . . . . . . . 20 Definitions. . . . . . . . . . . . . . . . . . . . . . . . . . . . . . . . . . . . . . . . . . . . . . . . . . . . . . . . . . . . . . . . . . . . . . . . . 20 Conditions Required to Meet Specifications. . . . . . . . . . . . . . . . . . . . . . . . . . . . . . . . . . . . . . . . . . . . . . . 20 Certification. . . . . . . . . . . . . . . . . . . . . . . . . . . . . . . . . . . . . . . . . . . . . . . . . . . . . . . . . . . . . . . . . . . . . . . . 20 Frequency and Time . . . . . . . . . . . . . . . . . . . . . . . . . . . . . . . . . . . . . . . . . . . . . . . . . . . . . . . . . . . . . . . . . . . 21 Frequency Range. . . . . . . . . . . . . . . . . . . . . . . . . . . . . . . . . . . . . . . . . . . . . . . . . . . . . . . . . . . . . . . . . . . . 21 Band . . . . . . . . . . . . . . . . . . . . . . . . . . . . . . . . . . . . . . . . . . . . . . . . . . . . . . . . . . . . . . . . . . . . . . . . . . . . . 21 Standard Frequency Reference . . . . . . . . . . . . . . . . . . . . . . . . . . . . . . . . . . . . . . . . . . . . . . . . . . . . . . . . . 22 Precision Frequency Reference. . . . . . . . . . . . . . . . . . . . . . . . . . . . . . . . . . . . . . . . . . . . . . . . . . . . . . . . . 23 Frequency Readout Accuracy . . . . . . . . . . . . . . . . . . . . . . . . . . . . . . . . . . . . . . . . . . . . . . . . . . . . . . . . . . 24 Frequency Counter . . . . . . . . . . . . . . . . . . . . . . . . . . . . . . . . . . . . . . . . . . . . . . . . . . . . . . . . . . . . . . . . . . 25 Frequency Span . . . . . . . . . . . . . . . . . . . . . . . . . . . . . . . . . . . . . . . . . . . . . . . . . . . . . . . . . . . . . . . . . . . . . 25 Sweep Time and Trigger . . . . . . . . . . . . . . . . . . . . . . . . . . . . . . . . . . . . . . . . . . . . . . . . . . . . . . . . . . . . . . 26 Triggers . . . . . . . . . . . . . . . . . . . . . . . . . . . . . . . . . . . . . . . . . . . . . . . . . . . . . . . . . . . . . . . . . . . . . . . . . . . 27 Gated Sweep . . . . . . . . . . . . . . . . . . . . . . . . . . . . . . . . . . . . . . . . . . . . . . . . . . . . . . . . . . . . . . . . . . . . . . . 28 Number of Frequency Sweep Points (buckets) . . . . . . . . . . . . . . . . . . . . . . . . . . . . . . . . . . . . . . . . . . . . 29 Nominal Measurement Time vs. Span [Plot] . . . . . . . . . . . . . . . . . . . . . . . . . . . . . . . . . . . . . . . . . . . . . . 29 Resolution Bandwidth (RBW) . . . . . . . . . . . . . . . . . . . . . . . . . . . . . . . . . . . . . . . . . . . . . . . . . . . . . . . . . 30 Analysis Bandwidth . . . . . . . . . . . . . . . . . . . . . . . . . . . . . . . . . . . . . . . . . . . . . . . . . . . . . . . . . . . . . . . . . 31 Preselector Bandwidth. . . . . . . . . . . . . . . . . . . . . . . . . . . . . . . . . . . . . . . . . . . . . . . . . . . . . . . . . . . . . . . . 31 Video Bandwidth (VBW) . . . . . . . . . . . . . . . . . . . . . . . . . . . . . . . . . . . . . . . . . . . . . . . . . . . . . . . . . . . . . 32 Amplitude Accuracy and Range . . . . . . . . . . . . . . . . . . . . . . . . . . . . . . . . . . . . . . . . . . . . . . . . . . . . . . . . . . 33 Measurement Range . . . . . . . . . . . . . . . . . . . . . . . . . . . . . . . . . . . . . . . . . . . . . . . . . . . . . . . . . . . . . . . . . 33 Maximum Safe Input Level. . . . . . . . . . . . . . . . . . . . . . . . . . . . . . . . . . . . . . . . . . . . . . . . . . . . . . . . . . . . 33 Display Range . . . . . . . . . . . . . . . . . . . . . . . . . . . . . . . . . . . . . . . . . . . . . . . . . . . . . . . . . . . . . . . . . . . . . . 33 Marker Readout. . . . . . . . . . . . . . . . . . . . . . . . . . . . . . . . . . . . . . . . . . . . . . . . . . . . . . . . . . . . . . . . . . . . . 34 Frequency Response . . . . . . . . . . . . . . . . . . . . . . . . . . . . . . . . . . . . . . . . . . . . . . . . . . . . . . . . . . . . . . . . . 35 IF Frequency Response . . . . . . . . . . . . . . . . . . . . . . . . . . . . . . . . . . . . . . . . . . . . . . . . . . . . . . . . . . . . . . . 36 IF Phase Linearity . . . . . . . . . . . . . . . . . . . . . . . . . . . . . . . . . . . . . . . . . . . . . . . . . . . . . . . . . . . . . . . . . . . 37 Absolute Amplitude Accuracy . . . . . . . . . . . . . . . . . . . . . . . . . . . . . . . . . . . . . . . . . . . . . . . . . . . . . . . . . 37 RF Input VSWR . . . . . . . . . . . . . . . . . . . . . . . . . . . . . . . . . . . . . . . . . . . . . . . . . . . . . . . . . . . . . . . . . . . . 39 Resolution Bandwidth Switching Uncertainty . . . . . . . . . . . . . . . . . . . . . . . . . . . . . . . . . . . . . . . . . . . . . 39 Input Attenuation Switching Uncertainty . . . . . . . . . . . . . . . . . . . . . . . . . . . . . . . . . . . . . . . . . . . . . . . . . 39 Reference Level. . . . . . . . . . . . . . . . . . . . . . . . . . . . . . . . . . . . . . . . . . . . . . . . . . . . . . . . . . . . . . . . . . . . . 40 Display Scale Fidelity . . . . . . . . . . . . . . . . . . . . . . . . . . . . . . . . . . . . . . . . . . . . . . . . . . . . . . . . . . . . . . . . 41 Available Detectors . . . . . . . . . . . . . . . . . . . . . . . . . . . . . . . . . . . . . . . . . . . . . . . . . . . . . . . . . . . . . . . . . . 42 Dynamic Range. . . . . . . . . . . . . . . . . . . . . . . . . . . . . . . . . . . . . . . . . . . . . . . . . . . . . . . . . . . . . . . . . . . . . . . 43 Gain Compression . . . . . . . . . . . . . . . . . . . . . . . . . . . . . . . . . . . . . . . . . . . . . . . . . . . . . . . . . . . . . . . . . . . 43 Displayed Average Noise Level . . . . . . . . . . . . . . . . . . . . . . . . . . . . . . . . . . . . . . . . . . . . . . . . . . . . . . . . 46 Displayed Average Noise Level (DANL) . . . . . . . . . . . . . . . . . . . . . . . . . . . . . . . . . . . . . . . . . . . . . . . . . 46 Spurious Responses. . . . . . . . . . . . . . . . . . . . . . . . . . . . . . . . . . . . . . . . . . . . . . . . . . . . . . . . . . . . . . . . . . 48 Second Harmonic Distortion. . . . . . . . . . . . . . . . . . . . . . . . . . . . . . . . . . . . . . . . . . . . . . . . . . . . . . . . . . . 49 Third Order Intermodulation. . . . . . . . . . . . . . . . . . . . . . . . . . . . . . . . . . . . . . . . . . . . . . . . . . . . . . . . . . . 50 Nominal Dynamic Range vs. Offset Frequency vs. RBW for Freq Option ≤ 526 [Plot] . . . . . . . . . . . . . 51 Nominal Dynamic Range at 1 GHz for Freq Option ≤ 526 [Plot] . . . . . . . . . . . . . . . . . . . . . . . . . . . . . . 52 Nominal Dynamic Range Bands 1-4 for Freq Option ≤ 526 [Plot] . . . . . . . . . . . . . . . . . . . . . . . . . . . . . 52 Phase Noise . . . . . . . . . . . . . . . . . . . . . . . . . . . . . . . . . . . . . . . . . . . . . . . . . . . . . . . . . . . . . . . . . . . . . . . . 53 Nominal Phase Noise of Different LO Optimizations for Freq Option ≤ 526 [Plot] . . . . . . . . . . . . . . . . 54
5

Contents
Nominal Phase Noise of Different LO Optimizations for Freq Option > 526 [Plot] . . . . . . . . . . . . . . . . 55 Nominal Phase Noise of Different Center Frequencies for Freq Option ≤ 526 [Plot] . . . . . . . . . . . . . . . 56 Nominal Phase Noise of Different Center Frequencies for Freq Option >526 [Plot] . . . . . . . . . . . . . . . 57 Power Suite Measurements . . . . . . . . . . . . . . . . . . . . . . . . . . . . . . . . . . . . . . . . . . . . . . . . . . . . . . . . . . . . . 58 Channel Power . . . . . . . . . . . . . . . . . . . . . . . . . . . . . . . . . . . . . . . . . . . . . . . . . . . . . . . . . . . . . . . . . . . . . 58 Occupied Bandwidth. . . . . . . . . . . . . . . . . . . . . . . . . . . . . . . . . . . . . . . . . . . . . . . . . . . . . . . . . . . . . . . . . 58 Adjacent Channel Power (ACP) . . . . . . . . . . . . . . . . . . . . . . . . . . . . . . . . . . . . . . . . . . . . . . . . . . . . . . . . 59 Fast ACPR Test [Plot]. . . . . . . . . . . . . . . . . . . . . . . . . . . . . . . . . . . . . . . . . . . . . . . . . . . . . . . . . . . . . . . . 62 Power Statistics CCDF . . . . . . . . . . . . . . . . . . . . . . . . . . . . . . . . . . . . . . . . . . . . . . . . . . . . . . . . . . . . . . . 62 Burst Power. . . . . . . . . . . . . . . . . . . . . . . . . . . . . . . . . . . . . . . . . . . . . . . . . . . . . . . . . . . . . . . . . . . . . . . . 63 TOI (Third Order Intermodulation) . . . . . . . . . . . . . . . . . . . . . . . . . . . . . . . . . . . . . . . . . . . . . . . . . . . . . 63 Harmonic Distortion . . . . . . . . . . . . . . . . . . . . . . . . . . . . . . . . . . . . . . . . . . . . . . . . . . . . . . . . . . . . . . . . . 63 Spurious Emissions. . . . . . . . . . . . . . . . . . . . . . . . . . . . . . . . . . . . . . . . . . . . . . . . . . . . . . . . . . . . . . . . . . 63 Spectrum Emission Mask . . . . . . . . . . . . . . . . . . . . . . . . . . . . . . . . . . . . . . . . . . . . . . . . . . . . . . . . . . . . . 64 Options . . . . . . . . . . . . . . . . . . . . . . . . . . . . . . . . . . . . . . . . . . . . . . . . . . . . . . . . . . . . . . . . . . . . . . . . . . . . . 65 General . . . . . . . . . . . . . . . . . . . . . . . . . . . . . . . . . . . . . . . . . . . . . . . . . . . . . . . . . . . . . . . . . . . . . . . . . . . . . 67 Inputs/Outputs . . . . . . . . . . . . . . . . . . . . . . . . . . . . . . . . . . . . . . . . . . . . . . . . . . . . . . . . . . . . . . . . . . . . . . . 71 Front Panel . . . . . . . . . . . . . . . . . . . . . . . . . . . . . . . . . . . . . . . . . . . . . . . . . . . . . . . . . . . . . . . . . . . . . . . . 71 Rear Panel . . . . . . . . . . . . . . . . . . . . . . . . . . . . . . . . . . . . . . . . . . . . . . . . . . . . . . . . . . . . . . . . . . . . . . . . 72 Regulatory Information . . . . . . . . . . . . . . . . . . . . . . . . . . . . . . . . . . . . . . . . . . . . . . . . . . . . . . . . . . . . . . . . 75 Declaration of Conformity . . . . . . . . . . . . . . . . . . . . . . . . . . . . . . . . . . . . . . . . . . . . . . . . . . . . . . . . . . . . . . 76
2. I/Q Analyzer
Specifications Affected by I/Q Analyzer . . . . . . . . . . . . . . . . . . . . . . . . . . . . . . . . . . . . . . . . . . . . . . . . . . . 78
Frequency . . . . . . . . . . . . . . . . . . . . . . . . . . . . . . . . . . . . . . . . . . . . . . . . . . . . . . . . . . . . . . . . . . . . . . . . . . . 79
Clipping-to-Noise Dynamic Range . . . . . . . . . . . . . . . . . . . . . . . . . . . . . . . . . . . . . . . . . . . . . . . . . . . . . . . 80
Data Acquisition. . . . . . . . . . . . . . . . . . . . . . . . . . . . . . . . . . . . . . . . . . . . . . . . . . . . . . . . . . . . . . . . . . . . . . 81
Time Record Length (IQ pairs). . . . . . . . . . . . . . . . . . . . . . . . . . . . . . . . . . . . . . . . . . . . . . . . . . . . . . . . . 81
ADC Resolution . . . . . . . . . . . . . . . . . . . . . . . . . . . . . . . . . . . . . . . . . . . . . . . . . . . . . . . . . . . . . . . . . . . . 81
3. VXA Vector Signal and WLAN Modulation Analysis Application
Vector Signal Analysis Performance (N9064A-1FP/1TP) . . . . . . . . . . . . . . . . . . . . . . . . . . . . . . . . . . . . . . 84 Frequency . . . . . . . . . . . . . . . . . . . . . . . . . . . . . . . . . . . . . . . . . . . . . . . . . . . . . . . . . . . . . . . . . . . . . . . . . 84 Range . . . . . . . . . . . . . . . . . . . . . . . . . . . . . . . . . . . . . . . . . . . . . . . . . . . . . . . . . . . . . . . . . . . . . . . . . . . . 84 Center Frequency Tuning Resolution . . . . . . . . . . . . . . . . . . . . . . . . . . . . . . . . . . . . . . . . . . . . . . . . . . . . 84 Frequency Span, Maximum . . . . . . . . . . . . . . . . . . . . . . . . . . . . . . . . . . . . . . . . . . . . . . . . . . . . . . . . . . . 84 FFT Spectrum . . . . . . . . . . . . . . . . . . . . . . . . . . . . . . . . . . . . . . . . . . . . . . . . . . . . . . . . . . . . . . . . . . . . . . 84 Frequency Points per Span . . . . . . . . . . . . . . . . . . . . . . . . . . . . . . . . . . . . . . . . . . . . . . . . . . . . . . . . . . . . 84 FFT Window Type . . . . . . . . . . . . . . . . . . . . . . . . . . . . . . . . . . . . . . . . . . . . . . . . . . . . . . . . . . . . . . . . . . 84 Input . . . . . . . . . . . . . . . . . . . . . . . . . . . . . . . . . . . . . . . . . . . . . . . . . . . . . . . . . . . . . . . . . . . . . . . . . . . . . 85 Range . . . . . . . . . . . . . . . . . . . . . . . . . . . . . . . . . . . . . . . . . . . . . . . . . . . . . . . . . . . . . . . . . . . . . . . . . . . . 85 ADC overload . . . . . . . . . . . . . . . . . . . . . . . . . . . . . . . . . . . . . . . . . . . . . . . . . . . . . . . . . . . . . . . . . . . . . . 85 Amplitude Accuracy . . . . . . . . . . . . . . . . . . . . . . . . . . . . . . . . . . . . . . . . . . . . . . . . . . . . . . . . . . . . . . . . . 86 Absolute Amplitude Accuracy . . . . . . . . . . . . . . . . . . . . . . . . . . . . . . . . . . . . . . . . . . . . . . . . . . . . . . . . . 86 Amplitude Linearity . . . . . . . . . . . . . . . . . . . . . . . . . . . . . . . . . . . . . . . . . . . . . . . . . . . . . . . . . . . . . . . . . 86 IF Flatness. . . . . . . . . . . . . . . . . . . . . . . . . . . . . . . . . . . . . . . . . . . . . . . . . . . . . . . . . . . . . . . . . . . . . . . . . 86 Sensitivity . . . . . . . . . . . . . . . . . . . . . . . . . . . . . . . . . . . . . . . . . . . . . . . . . . . . . . . . . . . . . . . . . . . . . . . . . 86 Dynamic Range. . . . . . . . . . . . . . . . . . . . . . . . . . . . . . . . . . . . . . . . . . . . . . . . . . . . . . . . . . . . . . . . . . . . . 87
6

Contents
Third Order Intermodulation distortion. . . . . . . . . . . . . . . . . . . . . . . . . . . . . . . . . . . . . . . . . . . . . . . . . . . 87 Noise Density at 1 GHz. . . . . . . . . . . . . . . . . . . . . . . . . . . . . . . . . . . . . . . . . . . . . . . . . . . . . . . . . . . . . . . 87 Residual Responses . . . . . . . . . . . . . . . . . . . . . . . . . . . . . . . . . . . . . . . . . . . . . . . . . . . . . . . . . . . . . . . . . . 87 Image Responses . . . . . . . . . . . . . . . . . . . . . . . . . . . . . . . . . . . . . . . . . . . . . . . . . . . . . . . . . . . . . . . . . . . . 87 LO Related Spurious . . . . . . . . . . . . . . . . . . . . . . . . . . . . . . . . . . . . . . . . . . . . . . . . . . . . . . . . . . . . . . . . . 87 Other Spurious. . . . . . . . . . . . . . . . . . . . . . . . . . . . . . . . . . . . . . . . . . . . . . . . . . . . . . . . . . . . . . . . . . . . . . 87
Analog Modulation Analysis (N9064A-1FP/1TP) . . . . . . . . . . . . . . . . . . . . . . . . . . . . . . . . . . . . . . . . . . . . 88 AM Demodulation. . . . . . . . . . . . . . . . . . . . . . . . . . . . . . . . . . . . . . . . . . . . . . . . . . . . . . . . . . . . . . . . . . . 88 PM Demodulation . . . . . . . . . . . . . . . . . . . . . . . . . . . . . . . . . . . . . . . . . . . . . . . . . . . . . . . . . . . . . . . . . . . 88 FM Demodulation . . . . . . . . . . . . . . . . . . . . . . . . . . . . . . . . . . . . . . . . . . . . . . . . . . . . . . . . . . . . . . . . . . . 89 Flexible Digital Modulation Analysis (N9064A-2FP/2TP) . . . . . . . . . . . . . . . . . . . . . . . . . . . . . . . . . . . . . 90 Accuracy . . . . . . . . . . . . . . . . . . . . . . . . . . . . . . . . . . . . . . . . . . . . . . . . . . . . . . . . . . . . . . . . . . . . . . . . . . 90 Residual EVM for Video Modulation Formats . . . . . . . . . . . . . . . . . . . . . . . . . . . . . . . . . . . . . . . . . . . . . 91 WLAN Modulation Analysis (N9064A-3FP/3TP). . . . . . . . . . . . . . . . . . . . . . . . . . . . . . . . . . . . . . . . . . . . 92 IEEE 802.11a/g OFDM. . . . . . . . . . . . . . . . . . . . . . . . . . . . . . . . . . . . . . . . . . . . . . . . . . . . . . . . . . . . . . . 92 IEEE 802.11b/g DSSS. . . . . . . . . . . . . . . . . . . . . . . . . . . . . . . . . . . . . . . . . . . . . . . . . . . . . . . . . . . . . . . . 92
4. Option B25 — 25 MHz Analysis Bandwidth
Specifications Affected by Analysis Bandwidth . . . . . . . . . . . . . . . . . . . . . . . . . . . . . . . . . . . . . . . . . . . . . 94
Other Analysis Bandwidth Specifications . . . . . . . . . . . . . . . . . . . . . . . . . . . . . . . . . . . . . . . . . . . . . . . . . . 95
IF Spurious Response . . . . . . . . . . . . . . . . . . . . . . . . . . . . . . . . . . . . . . . . . . . . . . . . . . . . . . . . . . . . . . . . 95
IF Frequency Response . . . . . . . . . . . . . . . . . . . . . . . . . . . . . . . . . . . . . . . . . . . . . . . . . . . . . . . . . . . . . . . 96
IF Phase Linearity . . . . . . . . . . . . . . . . . . . . . . . . . . . . . . . . . . . . . . . . . . . . . . . . . . . . . . . . . . . . . . . . . . . 97
Data Acquisition . . . . . . . . . . . . . . . . . . . . . . . . . . . . . . . . . . . . . . . . . . . . . . . . . . . . . . . . . . . . . . . . . . . . . . 98
Time Record Length (IQ pairs) . . . . . . . . . . . . . . . . . . . . . . . . . . . . . . . . . . . . . . . . . . . . . . . . . . . . . . . . . 98
ADC Resolution . . . . . . . . . . . . . . . . . . . . . . . . . . . . . . . . . . . . . . . . . . . . . . . . . . . . . . . . . . . . . . . . . . . . 98
5. Option B40 — 40 MHz Analysis Bandwidth
Specifications Affected by Analysis Bandwidth . . . . . . . . . . . . . . . . . . . . . . . . . . . . . . . . . . . . . . . . . . . . 100
Other Analysis Bandwidth Specifications . . . . . . . . . . . . . . . . . . . . . . . . . . . . . . . . . . . . . . . . . . . . . . . . . 101
IF Frequency Response . . . . . . . . . . . . . . . . . . . . . . . . . . . . . . . . . . . . . . . . . . . . . . . . . . . . . . . . . . . . . . 102
IF Phase Linearity . . . . . . . . . . . . . . . . . . . . . . . . . . . . . . . . . . . . . . . . . . . . . . . . . . . . . . . . . . . . . . . . . . 103
EVM . . . . . . . . . . . . . . . . . . . . . . . . . . . . . . . . . . . . . . . . . . . . . . . . . . . . . . . . . . . . . . . . . . . . . . . . . . . . 104
Data Acquisition . . . . . . . . . . . . . . . . . . . . . . . . . . . . . . . . . . . . . . . . . . . . . . . . . . . . . . . . . . . . . . . . . . . . . 105
Time Record Length . . . . . . . . . . . . . . . . . . . . . . . . . . . . . . . . . . . . . . . . . . . . . . . . . . . . . . . . . . . . . . . . 105
ADC Resolution . . . . . . . . . . . . . . . . . . . . . . . . . . . . . . . . . . . . . . . . . . . . . . . . . . . . . . . . . . . . . . . . . . . 105
Capture Time [Plot]. . . . . . . . . . . . . . . . . . . . . . . . . . . . . . . . . . . . . . . . . . . . . . . . . . . . . . . . . . . . . . . . . 105
6. Option CR3 — Connector Rear, 2nd IF Output
Specifications Affected by Connector Rear, 2nd IF Output . . . . . . . . . . . . . . . . . . . . . . . . . . . . . . . . . . . . 108 Other Connector Rear, 2nd IF Output Specifications . . . . . . . . . . . . . . . . . . . . . . . . . . . . . . . . . . . . . . . . . 109 Aux IF Out Port. . . . . . . . . . . . . . . . . . . . . . . . . . . . . . . . . . . . . . . . . . . . . . . . . . . . . . . . . . . . . . . . . . . . 109 Second IF Out . . . . . . . . . . . . . . . . . . . . . . . . . . . . . . . . . . . . . . . . . . . . . . . . . . . . . . . . . . . . . . . . . . . . . 109
7. Option CRP — Connector Rear, Arbitrary IF Output
Specifications Affected by Connector Rear, Arbitrary IF Output . . . . . . . . . . . . . . . . . . . . . . . . . . . . . . . 112 Other Connector Rear, Arbitrary IF Output Specifications . . . . . . . . . . . . . . . . . . . . . . . . . . . . . . . . . . . . 113 Aux IF Out Port. . . . . . . . . . . . . . . . . . . . . . . . . . . . . . . . . . . . . . . . . . . . . . . . . . . . . . . . . . . . . . . . . . . . 113
7

Contents
Arbitrary IF Out . . . . . . . . . . . . . . . . . . . . . . . . . . . . . . . . . . . . . . . . . . . . . . . . . . . . . . . . . . . . . . . . . . . 113
8. Option EA3 — Electronic Attenuator, 3.6 GHz
Specifications Affected by Electronic Attenuator . . . . . . . . . . . . . . . . . . . . . . . . . . . . . . . . . . . . . . . . . . . 116
Other Electronic Attenuator Specifications . . . . . . . . . . . . . . . . . . . . . . . . . . . . . . . . . . . . . . . . . . . . . . . . 117
Range (Frequency and Attenuation) . . . . . . . . . . . . . . . . . . . . . . . . . . . . . . . . . . . . . . . . . . . . . . . . . . . . 117
Distortions and Noise . . . . . . . . . . . . . . . . . . . . . . . . . . . . . . . . . . . . . . . . . . . . . . . . . . . . . . . . . . . . . . . 118
Frequency Response . . . . . . . . . . . . . . . . . . . . . . . . . . . . . . . . . . . . . . . . . . . . . . . . . . . . . . . . . . . . . . . . 119
Absolute Amplitude Accuracy . . . . . . . . . . . . . . . . . . . . . . . . . . . . . . . . . . . . . . . . . . . . . . . . . . . . . . . . 119
Electronic Attenuator Switching Uncertainty. . . . . . . . . . . . . . . . . . . . . . . . . . . . . . . . . . . . . . . . . . . . . 120
9. Option EMC — Precompliance EMI Features
Frequency . . . . . . . . . . . . . . . . . . . . . . . . . . . . . . . . . . . . . . . . . . . . . . . . . . . . . . . . . . . . . . . . . . . . . . . . . . 122
Frequency Range . . . . . . . . . . . . . . . . . . . . . . . . . . . . . . . . . . . . . . . . . . . . . . . . . . . . . . . . . . . . . . . . . . 122
EMI Resolution Bandwidths. . . . . . . . . . . . . . . . . . . . . . . . . . . . . . . . . . . . . . . . . . . . . . . . . . . . . . . . . . 122
Amplitude. . . . . . . . . . . . . . . . . . . . . . . . . . . . . . . . . . . . . . . . . . . . . . . . . . . . . . . . . . . . . . . . . . . . . . . . . . 124
EMI Average Detector . . . . . . . . . . . . . . . . . . . . . . . . . . . . . . . . . . . . . . . . . . . . . . . . . . . . . . . . . . . . . . 124
Quasi-Peak Detector . . . . . . . . . . . . . . . . . . . . . . . . . . . . . . . . . . . . . . . . . . . . . . . . . . . . . . . . . . . . . . . . 124
RMS Average Detector . . . . . . . . . . . . . . . . . . . . . . . . . . . . . . . . . . . . . . . . . . . . . . . . . . . . . . . . . . . . . . 124
10. Option ESC — External Source Control
General Specifications . . . . . . . . . . . . . . . . . . . . . . . . . . . . . . . . . . . . . . . . . . . . . . . . . . . . . . . . . . . . . . . . 126
Frequency Range . . . . . . . . . . . . . . . . . . . . . . . . . . . . . . . . . . . . . . . . . . . . . . . . . . . . . . . . . . . . . . . . . . 126
Dynamic Range. . . . . . . . . . . . . . . . . . . . . . . . . . . . . . . . . . . . . . . . . . . . . . . . . . . . . . . . . . . . . . . . . . . . 127
Power Sweep Range . . . . . . . . . . . . . . . . . . . . . . . . . . . . . . . . . . . . . . . . . . . . . . . . . . . . . . . . . . . . . . . . 128
Measurement Time . . . . . . . . . . . . . . . . . . . . . . . . . . . . . . . . . . . . . . . . . . . . . . . . . . . . . . . . . . . . . . . . . 128
Supported External Sources . . . . . . . . . . . . . . . . . . . . . . . . . . . . . . . . . . . . . . . . . . . . . . . . . . . . . . . . . . 129
11. Option EXM — External Mixing
Specifications Affected by External mixing. . . . . . . . . . . . . . . . . . . . . . . . . . . . . . . . . . . . . . . . . . . . . . . . 132
Other External Mixing Specifications . . . . . . . . . . . . . . . . . . . . . . . . . . . . . . . . . . . . . . . . . . . . . . . . . . . . 133
Connection Port EXT MIXER . . . . . . . . . . . . . . . . . . . . . . . . . . . . . . . . . . . . . . . . . . . . . . . . . . . . . . . . 133
Mixer Bias. . . . . . . . . . . . . . . . . . . . . . . . . . . . . . . . . . . . . . . . . . . . . . . . . . . . . . . . . . . . . . . . . . . . . . . . 133
IF Input . . . . . . . . . . . . . . . . . . . . . . . . . . . . . . . . . . . . . . . . . . . . . . . . . . . . . . . . . . . . . . . . . . . . . . . . . . 133
LO Output . . . . . . . . . . . . . . . . . . . . . . . . . . . . . . . . . . . . . . . . . . . . . . . . . . . . . . . . . . . . . . . . . . . . . . . . 134
12. Option MPB — Microwave Preselector Bypass
Specifications Affected by Microwave Preselector Bypass. . . . . . . . . . . . . . . . . . . . . . . . . . . . . . . . . . . . 136
Other Microwave Preselector Bypass Specifications. . . . . . . . . . . . . . . . . . . . . . . . . . . . . . . . . . . . . . . . . 137
Additional Spurious Responses . . . . . . . . . . . . . . . . . . . . . . . . . . . . . . . . . . . . . . . . . . . . . . . . . . . . . . . 138
13. Option P03, P07, P13, P26, P32 and P44 — Preamplifier
Specifications Affected by Preamp . . . . . . . . . . . . . . . . . . . . . . . . . . . . . . . . . . . . . . . . . . . . . . . . . . . . . . 140 Other Preamp Specifications . . . . . . . . . . . . . . . . . . . . . . . . . . . . . . . . . . . . . . . . . . . . . . . . . . . . . . . . . . . 141 Gain. . . . . . . . . . . . . . . . . . . . . . . . . . . . . . . . . . . . . . . . . . . . . . . . . . . . . . . . . . . . . . . . . . . . . . . . . . . . . 141 Noise figure. . . . . . . . . . . . . . . . . . . . . . . . . . . . . . . . . . . . . . . . . . . . . . . . . . . . . . . . . . . . . . . . . . . . . . . 141 1 dB Gain Compression Point . . . . . . . . . . . . . . . . . . . . . . . . . . . . . . . . . . . . . . . . . . . . . . . . . . . . . . . . 142
8

Contents
Displayed Average Noise Level (DANL)Preamp On . . . . . . . . . . . . . . . . . . . . . . . . . . . . . . . . . . . . . . . 143 Frequency Response − Preamp On . . . . . . . . . . . . . . . . . . . . . . . . . . . . . . . . . . . . . . . . . . . . . . . . . . . . . 144 RF Input VSWR . . . . . . . . . . . . . . . . . . . . . . . . . . . . . . . . . . . . . . . . . . . . . . . . . . . . . . . . . . . . . . . . . . . 145 Nominal VSWR − Preamp On, Freq Option ≤ 526 [Plot] . . . . . . . . . . . . . . . . . . . . . . . . . . . . . . . . . . . 146 Third Order Intermodulation Distortion . . . . . . . . . . . . . . . . . . . . . . . . . . . . . . . . . . . . . . . . . . . . . . . . . 146 Nominal Dynamic Range at 1 GHz, Preamp On, Freq Option ≤ 526 [Plot]. . . . . . . . . . . . . . . . . . . . . . 147
14. Option PFR — Precision Frequency Reference
Specifications Affected by Precision Frequency Reference. . . . . . . . . . . . . . . . . . . . . . . . . . . . . . . . . . . . 150
15. Option YAS — Y-Axis Screen Video Output
Specifications Affected by Y-Axis Screen Video Output . . . . . . . . . . . . . . . . . . . . . . . . . . . . . . . . . . . . . . 152
Other Y-Axis Screen Video Output Specifications. . . . . . . . . . . . . . . . . . . . . . . . . . . . . . . . . . . . . . . . . . . 153
General Port Specifications. . . . . . . . . . . . . . . . . . . . . . . . . . . . . . . . . . . . . . . . . . . . . . . . . . . . . . . . . . . 153
Screen Video . . . . . . . . . . . . . . . . . . . . . . . . . . . . . . . . . . . . . . . . . . . . . . . . . . . . . . . . . . . . . . . . . . . . . . 153
Delay . . . . . . . . . . . . . . . . . . . . . . . . . . . . . . . . . . . . . . . . . . . . . . . . . . . . . . . . . . . . . . . . . . . . . . . . . . . 154
Continuity and Compatibility . . . . . . . . . . . . . . . . . . . . . . . . . . . . . . . . . . . . . . . . . . . . . . . . . . . . . . . . . 155
16. Analog Demodulation Measurement Application
Pre-Demodulation. . . . . . . . . . . . . . . . . . . . . . . . . . . . . . . . . . . . . . . . . . . . . . . . . . . . . . . . . . . . . . . . . . . . 158
Carrier Frequency . . . . . . . . . . . . . . . . . . . . . . . . . . . . . . . . . . . . . . . . . . . . . . . . . . . . . . . . . . . . . . . . . . 158
Demodulation Bandwidth . . . . . . . . . . . . . . . . . . . . . . . . . . . . . . . . . . . . . . . . . . . . . . . . . . . . . . . . . . . . 158
Capture Memory . . . . . . . . . . . . . . . . . . . . . . . . . . . . . . . . . . . . . . . . . . . . . . . . . . . . . . . . . . . . . . . . . . . 158
Post-Demodulation . . . . . . . . . . . . . . . . . . . . . . . . . . . . . . . . . . . . . . . . . . . . . . . . . . . . . . . . . . . . . . . . . . . 159
Maximum Audio Frequency Span . . . . . . . . . . . . . . . . . . . . . . . . . . . . . . . . . . . . . . . . . . . . . . . . . . . . . 159
Filters. . . . . . . . . . . . . . . . . . . . . . . . . . . . . . . . . . . . . . . . . . . . . . . . . . . . . . . . . . . . . . . . . . . . . . . . . . . . 159
Frequency Modulation — Level and Carrier Metrics . . . . . . . . . . . . . . . . . . . . . . . . . . . . . . . . . . . . . . . . . . 160
FM Deviation Accuracy . . . . . . . . . . . . . . . . . . . . . . . . . . . . . . . . . . . . . . . . . . . . . . . . . . . . . . . . . . . . . 160
FM Rate Accuracy . . . . . . . . . . . . . . . . . . . . . . . . . . . . . . . . . . . . . . . . . . . . . . . . . . . . . . . . . . . . . . . . . 160
Carrier Frequency Error . . . . . . . . . . . . . . . . . . . . . . . . . . . . . . . . . . . . . . . . . . . . . . . . . . . . . . . . . . . . . 160
Carrier Power . . . . . . . . . . . . . . . . . . . . . . . . . . . . . . . . . . . . . . . . . . . . . . . . . . . . . . . . . . . . . . . . . . . . . 160
Frequency Modulation — Distortion . . . . . . . . . . . . . . . . . . . . . . . . . . . . . . . . . . . . . . . . . . . . . . . . . . . . . . 161
Residual. . . . . . . . . . . . . . . . . . . . . . . . . . . . . . . . . . . . . . . . . . . . . . . . . . . . . . . . . . . . . . . . . . . . . . . . . . 161
Absolute Accuracy . . . . . . . . . . . . . . . . . . . . . . . . . . . . . . . . . . . . . . . . . . . . . . . . . . . . . . . . . . . . . . . . . 161
AM Rejection . . . . . . . . . . . . . . . . . . . . . . . . . . . . . . . . . . . . . . . . . . . . . . . . . . . . . . . . . . . . . . . . . . . . . 161
Residual FM . . . . . . . . . . . . . . . . . . . . . . . . . . . . . . . . . . . . . . . . . . . . . . . . . . . . . . . . . . . . . . . . . . . . . . 161
Measurement Range . . . . . . . . . . . . . . . . . . . . . . . . . . . . . . . . . . . . . . . . . . . . . . . . . . . . . . . . . . . . . . . . 161
Amplitude Modulation — Level and Carrier Metrics. . . . . . . . . . . . . . . . . . . . . . . . . . . . . . . . . . . . . . . . . . 162
AM Depth Accuracy . . . . . . . . . . . . . . . . . . . . . . . . . . . . . . . . . . . . . . . . . . . . . . . . . . . . . . . . . . . . . . . . 162
AM Rate Accuracy. . . . . . . . . . . . . . . . . . . . . . . . . . . . . . . . . . . . . . . . . . . . . . . . . . . . . . . . . . . . . . . . . 162
Carrier Power . . . . . . . . . . . . . . . . . . . . . . . . . . . . . . . . . . . . . . . . . . . . . . . . . . . . . . . . . . . . . . . . . . . . . 162
Amplitude Modulation — Distortion . . . . . . . . . . . . . . . . . . . . . . . . . . . . . . . . . . . . . . . . . . . . . . . . . . . . . . 163
Absolute Accuracy . . . . . . . . . . . . . . . . . . . . . . . . . . . . . . . . . . . . . . . . . . . . . . . . . . . . . . . . . . . . . . . . . 163
FM Rejection. . . . . . . . . . . . . . . . . . . . . . . . . . . . . . . . . . . . . . . . . . . . . . . . . . . . . . . . . . . . . . . . . . . . . . 163
Residual AM . . . . . . . . . . . . . . . . . . . . . . . . . . . . . . . . . . . . . . . . . . . . . . . . . . . . . . . . . . . . . . . . . . . . . . 163
Measurement Range . . . . . . . . . . . . . . . . . . . . . . . . . . . . . . . . . . . . . . . . . . . . . . . . . . . . . . . . . . . . . . . . 163
Phase Modulation — Level and Carrier Metrics. . . . . . . . . . . . . . . . . . . . . . . . . . . . . . . . . . . . . . . . . . . . . . 164
PM Deviation Accuracy . . . . . . . . . . . . . . . . . . . . . . . . . . . . . . . . . . . . . . . . . . . . . . . . . . . . . . . . . . . . . 164
9

Contents
PM Rate Accuracy . . . . . . . . . . . . . . . . . . . . . . . . . . . . . . . . . . . . . . . . . . . . . . . . . . . . . . . . . . . . . . . . . 164
Carrier Frequency Error . . . . . . . . . . . . . . . . . . . . . . . . . . . . . . . . . . . . . . . . . . . . . . . . . . . . . . . . . . . . . 164
Carrier Power . . . . . . . . . . . . . . . . . . . . . . . . . . . . . . . . . . . . . . . . . . . . . . . . . . . . . . . . . . . . . . . . . . . . . 164
Phase Modulation — Distortion . . . . . . . . . . . . . . . . . . . . . . . . . . . . . . . . . . . . . . . . . . . . . . . . . . . . . . . . . . 165
Residual . . . . . . . . . . . . . . . . . . . . . . . . . . . . . . . . . . . . . . . . . . . . . . . . . . . . . . . . . . . . . . . . . . . . . . . . . 165
Absolute Accuracy . . . . . . . . . . . . . . . . . . . . . . . . . . . . . . . . . . . . . . . . . . . . . . . . . . . . . . . . . . . . . . . . . 165
AM Rejection . . . . . . . . . . . . . . . . . . . . . . . . . . . . . . . . . . . . . . . . . . . . . . . . . . . . . . . . . . . . . . . . . . . . . 165
Measurement Range . . . . . . . . . . . . . . . . . . . . . . . . . . . . . . . . . . . . . . . . . . . . . . . . . . . . . . . . . . . . . . . . 165
FM Stereo/Radio Data System (RDS) Measurements . . . . . . . . . . . . . . . . . . . . . . . . . . . . . . . . . . . . . . . . 166
FM Stereo Modulation Analysis Measurements. . . . . . . . . . . . . . . . . . . . . . . . . . . . . . . . . . . . . . . . . . . 166
17. Noise Figure Measurement Application
General Specifications . . . . . . . . . . . . . . . . . . . . . . . . . . . . . . . . . . . . . . . . . . . . . . . . . . . . . . . . . . . . . . . . 170
Noise Figure . . . . . . . . . . . . . . . . . . . . . . . . . . . . . . . . . . . . . . . . . . . . . . . . . . . . . . . . . . . . . . . . . . . . . . 170
Gain. . . . . . . . . . . . . . . . . . . . . . . . . . . . . . . . . . . . . . . . . . . . . . . . . . . . . . . . . . . . . . . . . . . . . . . . . . . . . 171
Noise Figure Uncertainty Calculator . . . . . . . . . . . . . . . . . . . . . . . . . . . . . . . . . . . . . . . . . . . . . . . . . . . 172
Nominal Instrument Noise Figure, Freq Option ≤ 526. . . . . . . . . . . . . . . . . . . . . . . . . . . . . . . . . . . . . . 173
Nominal Instrument Input VSWR, DC Coupled, Freq Option ≤ 526 . . . . . . . . . . . . . . . . . . . . . . . . . . 174
18. Phase Noise Measurement Application
General Specifications . . . . . . . . . . . . . . . . . . . . . . . . . . . . . . . . . . . . . . . . . . . . . . . . . . . . . . . . . . . . . . . . 176
Maximum Carrier Frequency . . . . . . . . . . . . . . . . . . . . . . . . . . . . . . . . . . . . . . . . . . . . . . . . . . . . . . . . . 176
Measurement Characteristics . . . . . . . . . . . . . . . . . . . . . . . . . . . . . . . . . . . . . . . . . . . . . . . . . . . . . . . . . 176
Measurement Accuracy . . . . . . . . . . . . . . . . . . . . . . . . . . . . . . . . . . . . . . . . . . . . . . . . . . . . . . . . . . . . . 177
Offset Frequency. . . . . . . . . . . . . . . . . . . . . . . . . . . . . . . . . . . . . . . . . . . . . . . . . . . . . . . . . . . . . . . . . . . 177
Amplitude Repeatability . . . . . . . . . . . . . . . . . . . . . . . . . . . . . . . . . . . . . . . . . . . . . . . . . . . . . . . . . . . . . 178
Nominal Phase Noise at Different Center Frequencies . . . . . . . . . . . . . . . . . . . . . . . . . . . . . . . . . . . . . 178
19. 1xEV-DO Measurement Application
Measurements. . . . . . . . . . . . . . . . . . . . . . . . . . . . . . . . . . . . . . . . . . . . . . . . . . . . . . . . . . . . . . . . . . . . . . . 180 Channel Power . . . . . . . . . . . . . . . . . . . . . . . . . . . . . . . . . . . . . . . . . . . . . . . . . . . . . . . . . . . . . . . . . . . . 180 Power Statistics CCDF . . . . . . . . . . . . . . . . . . . . . . . . . . . . . . . . . . . . . . . . . . . . . . . . . . . . . . . . . . . . . . 180 Occupied Bandwidth. . . . . . . . . . . . . . . . . . . . . . . . . . . . . . . . . . . . . . . . . . . . . . . . . . . . . . . . . . . . . . . . 180 Power vs. Time . . . . . . . . . . . . . . . . . . . . . . . . . . . . . . . . . . . . . . . . . . . . . . . . . . . . . . . . . . . . . . . . . . . 180 Spectrum Emission Mask and Adjacent Channel Power . . . . . . . . . . . . . . . . . . . . . . . . . . . . . . . . . . . . 181 Spurious Emissions . . . . . . . . . . . . . . . . . . . . . . . . . . . . . . . . . . . . . . . . . . . . . . . . . . . . . . . . . . . . . . . . 182 QPSK EVM . . . . . . . . . . . . . . . . . . . . . . . . . . . . . . . . . . . . . . . . . . . . . . . . . . . . . . . . . . . . . . . . . . . . . . 182 Code Domain . . . . . . . . . . . . . . . . . . . . . . . . . . . . . . . . . . . . . . . . . . . . . . . . . . . . . . . . . . . . . . . . . . . . . 182 Modulation Accuracy (Composite Rho). . . . . . . . . . . . . . . . . . . . . . . . . . . . . . . . . . . . . . . . . . . . . . . . . 183
In-Band Frequency Range . . . . . . . . . . . . . . . . . . . . . . . . . . . . . . . . . . . . . . . . . . . . . . . . . . . . . . . . . . . . . 184 In-Band Frequency Range . . . . . . . . . . . . . . . . . . . . . . . . . . . . . . . . . . . . . . . . . . . . . . . . . . . . . . . . . . . 184 Alternative Frequency Ranges . . . . . . . . . . . . . . . . . . . . . . . . . . . . . . . . . . . . . . . . . . . . . . . . . . . . . . . . 184
20. 802.16 OFDMA Measurement Application
Measurements. . . . . . . . . . . . . . . . . . . . . . . . . . . . . . . . . . . . . . . . . . . . . . . . . . . . . . . . . . . . . . . . . . . . . . . 186
Channel Power . . . . . . . . . . . . . . . . . . . . . . . . . . . . . . . . . . . . . . . . . . . . . . . . . . . . . . . . . . . . . . . . . . . . 186
Power Statistics CCDF . . . . . . . . . . . . . . . . . . . . . . . . . . . . . . . . . . . . . . . . . . . . . . . . . . . . . . . . . . . . . . 186
Occupied Bandwidth. . . . . . . . . . . . . . . . . . . . . . . . . . . . . . . . . . . . . . . . . . . . . . . . . . . . . . . . . . . . . . . . 186
10
![]()
Contents
Adjacent Channel Power. . . . . . . . . . . . . . . . . . . . . . . . . . . . . . . . . . . . . . . . . . . . . . . . . . . . . . . . . . . . . 187 Spectrum Emission Mask . . . . . . . . . . . . . . . . . . . . . . . . . . . . . . . . . . . . . . . . . . . . . . . . . . . . . . . . . . . . 188 Spurious Emissions . . . . . . . . . . . . . . . . . . . . . . . . . . . . . . . . . . . . . . . . . . . . . . . . . . . . . . . . . . . . . . . . . 188 Modulation Analysis . . . . . . . . . . . . . . . . . . . . . . . . . . . . . . . . . . . . . . . . . . . . . . . . . . . . . . . . . . . . . . . . 189 In-Band Frequency Range for Warranted Specifications . . . . . . . . . . . . . . . . . . . . . . . . . . . . . . . . . . . . . 190
21. Bluetooth Measurement Application
Basic Rate Measurements. . . . . . . . . . . . . . . . . . . . . . . . . . . . . . . . . . . . . . . . . . . . . . . . . . . . . . . . . . . . . . 192
Output Power. . . . . . . . . . . . . . . . . . . . . . . . . . . . . . . . . . . . . . . . . . . . . . . . . . . . . . . . . . . . . . . . . . . . . . 192
Modulation Characteristics . . . . . . . . . . . . . . . . . . . . . . . . . . . . . . . . . . . . . . . . . . . . . . . . . . . . . . . . . . . 193
Initial Carrier Frequency Tolerance . . . . . . . . . . . . . . . . . . . . . . . . . . . . . . . . . . . . . . . . . . . . . . . . . . . . 194
Carrier Frequency Drift. . . . . . . . . . . . . . . . . . . . . . . . . . . . . . . . . . . . . . . . . . . . . . . . . . . . . . . . . . . . . . 195
Adjacent Channel Power. . . . . . . . . . . . . . . . . . . . . . . . . . . . . . . . . . . . . . . . . . . . . . . . . . . . . . . . . . . . . 195
Low Energy Measurements . . . . . . . . . . . . . . . . . . . . . . . . . . . . . . . . . . . . . . . . . . . . . . . . . . . . . . . . . . . . 196
Output Power. . . . . . . . . . . . . . . . . . . . . . . . . . . . . . . . . . . . . . . . . . . . . . . . . . . . . . . . . . . . . . . . . . . . . . 196
Modulation Characteristics . . . . . . . . . . . . . . . . . . . . . . . . . . . . . . . . . . . . . . . . . . . . . . . . . . . . . . . . . . . 197
Initial Carrier Frequency Tolerance . . . . . . . . . . . . . . . . . . . . . . . . . . . . . . . . . . . . . . . . . . . . . . . . . . . . 198
Carrier Frequency Drift. . . . . . . . . . . . . . . . . . . . . . . . . . . . . . . . . . . . . . . . . . . . . . . . . . . . . . . . . . . . . . 199
LE In-band Emission. . . . . . . . . . . . . . . . . . . . . . . . . . . . . . . . . . . . . . . . . . . . . . . . . . . . . . . . . . . . . . . . 199
Enhanced Data Rate (EDR) Measurements . . . . . . . . . . . . . . . . . . . . . . . . . . . . . . . . . . . . . . . . . . . . . . . . 200
EDR Relative Transmit Power . . . . . . . . . . . . . . . . . . . . . . . . . . . . . . . . . . . . . . . . . . . . . . . . . . . . . . . . 200
EDR Modulation Accuracy. . . . . . . . . . . . . . . . . . . . . . . . . . . . . . . . . . . . . . . . . . . . . . . . . . . . . . . . . . . 201
EDR Carrier Frequency Stability . . . . . . . . . . . . . . . . . . . . . . . . . . . . . . . . . . . . . . . . . . . . . . . . . . . . . . 202
EDR In-band Spurious Emissions. . . . . . . . . . . . . . . . . . . . . . . . . . . . . . . . . . . . . . . . . . . . . . . . . . . . . . 203
In-Band Frequency Range . . . . . . . . . . . . . . . . . . . . . . . . . . . . . . . . . . . . . . . . . . . . . . . . . . . . . . . . . . . . . 204
Bluetooth Basic Rate and Enhanced Data Rate (EDR) System . . . . . . . . . . . . . . . . . . . . . . . . . . . . . . . 204
Bluetooth Low Energy System . . . . . . . . . . . . . . . . . . . . . . . . . . . . . . . . . . . . . . . . . . . . . . . . . . . . . . . . 204
22. cdma2000 Measurement Application
Measurements . . . . . . . . . . . . . . . . . . . . . . . . . . . . . . . . . . . . . . . . . . . . . . . . . . . . . . . . . . . . . . . . . . . . . . . 206 Channel Power . . . . . . . . . . . . . . . . . . . . . . . . . . . . . . . . . . . . . . . . . . . . . . . . . . . . . . . . . . . . . . . . . . . . 206 Adjacent Channel Power. . . . . . . . . . . . . . . . . . . . . . . . . . . . . . . . . . . . . . . . . . . . . . . . . . . . . . . . . . . . . 207 Power Statistics CCDF . . . . . . . . . . . . . . . . . . . . . . . . . . . . . . . . . . . . . . . . . . . . . . . . . . . . . . . . . . . . . . 207 Occupied Bandwidth . . . . . . . . . . . . . . . . . . . . . . . . . . . . . . . . . . . . . . . . . . . . . . . . . . . . . . . . . . . . . . . . 208 Spectrum Emission Mask . . . . . . . . . . . . . . . . . . . . . . . . . . . . . . . . . . . . . . . . . . . . . . . . . . . . . . . . . . . . 208 Spurious Emissions . . . . . . . . . . . . . . . . . . . . . . . . . . . . . . . . . . . . . . . . . . . . . . . . . . . . . . . . . . . . . . . . 209 Code Domain. . . . . . . . . . . . . . . . . . . . . . . . . . . . . . . . . . . . . . . . . . . . . . . . . . . . . . . . . . . . . . . . . . . . . . 209 QPSK EVM. . . . . . . . . . . . . . . . . . . . . . . . . . . . . . . . . . . . . . . . . . . . . . . . . . . . . . . . . . . . . . . . . . . . . . . 210 Modulation Accuracy (Composite Rho) . . . . . . . . . . . . . . . . . . . . . . . . . . . . . . . . . . . . . . . . . . . . . . . . . 211
In-Band Frequency Range . . . . . . . . . . . . . . . . . . . . . . . . . . . . . . . . . . . . . . . . . . . . . . . . . . . . . . . . . . . . . 213
23. CMMB Measurement Application
Measurements . . . . . . . . . . . . . . . . . . . . . . . . . . . . . . . . . . . . . . . . . . . . . . . . . . . . . . . . . . . . . . . . . . . . . . 216 Channel Power . . . . . . . . . . . . . . . . . . . . . . . . . . . . . . . . . . . . . . . . . . . . . . . . . . . . . . . . . . . . . . . . . . . . 216 Channel Power with Shoulder Attenuation View . . . . . . . . . . . . . . . . . . . . . . . . . . . . . . . . . . . . . . . . . . 216 Power Statistics CCDF . . . . . . . . . . . . . . . . . . . . . . . . . . . . . . . . . . . . . . . . . . . . . . . . . . . . . . . . . . . . . . 216 Adjacent Channel Power . . . . . . . . . . . . . . . . . . . . . . . . . . . . . . . . . . . . . . . . . . . . . . . . . . . . . . . . . . . . 217 Spectrum Emission Mask . . . . . . . . . . . . . . . . . . . . . . . . . . . . . . . . . . . . . . . . . . . . . . . . . . . . . . . . . . . . 218
11

Contents
Modulation Analysis Settings. . . . . . . . . . . . . . . . . . . . . . . . . . . . . . . . . . . . . . . . . . . . . . . . . . . . . . . . . 219
Modulation Analysis Measurement . . . . . . . . . . . . . . . . . . . . . . . . . . . . . . . . . . . . . . . . . . . . . . . . . . . . 220
CMMB Modulation Analysis Specification . . . . . . . . . . . . . . . . . . . . . . . . . . . . . . . . . . . . . . . . . . . . . . 222
24. Digital Cable TV Measurement Application
Measurements. . . . . . . . . . . . . . . . . . . . . . . . . . . . . . . . . . . . . . . . . . . . . . . . . . . . . . . . . . . . . . . . . . . . . . . 224
Channel Power . . . . . . . . . . . . . . . . . . . . . . . . . . . . . . . . . . . . . . . . . . . . . . . . . . . . . . . . . . . . . . . . . . . . 224
Power Statistics CCDF . . . . . . . . . . . . . . . . . . . . . . . . . . . . . . . . . . . . . . . . . . . . . . . . . . . . . . . . . . . . . . 224
Adjacent Channel Power . . . . . . . . . . . . . . . . . . . . . . . . . . . . . . . . . . . . . . . . . . . . . . . . . . . . . . . . . . . . 225
Spectrum Emission Mask . . . . . . . . . . . . . . . . . . . . . . . . . . . . . . . . . . . . . . . . . . . . . . . . . . . . . . . . . . . . 225
DVB-C 64QAM EVM . . . . . . . . . . . . . . . . . . . . . . . . . . . . . . . . . . . . . . . . . . . . . . . . . . . . . . . . . . . . . . 226
25. DTMB Measurement Application
Measurements. . . . . . . . . . . . . . . . . . . . . . . . . . . . . . . . . . . . . . . . . . . . . . . . . . . . . . . . . . . . . . . . . . . . . . . 228 Channel Power . . . . . . . . . . . . . . . . . . . . . . . . . . . . . . . . . . . . . . . . . . . . . . . . . . . . . . . . . . . . . . . . . . . . 228 Channel Power with Shoulder Attenuation View . . . . . . . . . . . . . . . . . . . . . . . . . . . . . . . . . . . . . . . . . . 228 Power Statistics CCDF . . . . . . . . . . . . . . . . . . . . . . . . . . . . . . . . . . . . . . . . . . . . . . . . . . . . . . . . . . . . . . 229 Adjacent Channel Power . . . . . . . . . . . . . . . . . . . . . . . . . . . . . . . . . . . . . . . . . . . . . . . . . . . . . . . . . . . . 229 Spectrum Emission Mask . . . . . . . . . . . . . . . . . . . . . . . . . . . . . . . . . . . . . . . . . . . . . . . . . . . . . . . . . . . . 230 16QAM EVM . . . . . . . . . . . . . . . . . . . . . . . . . . . . . . . . . . . . . . . . . . . . . . . . . . . . . . . . . . . . . . . . . . . . . 231
26. DVB-T/H with T2 Measurement Application
Measurements. . . . . . . . . . . . . . . . . . . . . . . . . . . . . . . . . . . . . . . . . . . . . . . . . . . . . . . . . . . . . . . . . . . . . . . 234 Channel Power . . . . . . . . . . . . . . . . . . . . . . . . . . . . . . . . . . . . . . . . . . . . . . . . . . . . . . . . . . . . . . . . . . . . 234 Channel Power with Shoulder Attenuation View . . . . . . . . . . . . . . . . . . . . . . . . . . . . . . . . . . . . . . . . . . 234 Power Statistics CCDF . . . . . . . . . . . . . . . . . . . . . . . . . . . . . . . . . . . . . . . . . . . . . . . . . . . . . . . . . . . . . . 235 Adjacent Channel Power . . . . . . . . . . . . . . . . . . . . . . . . . . . . . . . . . . . . . . . . . . . . . . . . . . . . . . . . . . . . 235 Spectrum Emission Mask . . . . . . . . . . . . . . . . . . . . . . . . . . . . . . . . . . . . . . . . . . . . . . . . . . . . . . . . . . . . 236 Spurious Emission . . . . . . . . . . . . . . . . . . . . . . . . . . . . . . . . . . . . . . . . . . . . . . . . . . . . . . . . . . . . . . . . . 237 DVB-T 64QAM EVM . . . . . . . . . . . . . . . . . . . . . . . . . . . . . . . . . . . . . . . . . . . . . . . . . . . . . . . . . . . . . . 238 DVB-T2 256QAM EVM . . . . . . . . . . . . . . . . . . . . . . . . . . . . . . . . . . . . . . . . . . . . . . . . . . . . . . . . . . . . 239
27. GSM/EDGE Measurement Application
Measurements. . . . . . . . . . . . . . . . . . . . . . . . . . . . . . . . . . . . . . . . . . . . . . . . . . . . . . . . . . . . . . . . . . . . . . . 242 EDGE Error Vector Magnitude
(EVM). . . . . . . . . . . . . . . . . . . . . . . . . . . . . . . . . . . . . . . . . . . . . . . . . . . . . . . . . . . . . . . . . . . . . . . . . . . 242 Power vs. Time . . . . . . . . . . . . . . . . . . . . . . . . . . . . . . . . . . . . . . . . . . . . . . . . . . . . . . . . . . . . . . . . . . . . 243 EDGE Power vs. Time . . . . . . . . . . . . . . . . . . . . . . . . . . . . . . . . . . . . . . . . . . . . . . . . . . . . . . . . . . . . . . 243 Power Ramp Relative Accuracy . . . . . . . . . . . . . . . . . . . . . . . . . . . . . . . . . . . . . . . . . . . . . . . . . . . . . . . 243 Phase and Frequency Error . . . . . . . . . . . . . . . . . . . . . . . . . . . . . . . . . . . . . . . . . . . . . . . . . . . . . . . . . . . 244 Output RF Spectrum (ORFS) . . . . . . . . . . . . . . . . . . . . . . . . . . . . . . . . . . . . . . . . . . . . . . . . . . . . . . . . . 245
Frequency Ranges . . . . . . . . . . . . . . . . . . . . . . . . . . . . . . . . . . . . . . . . . . . . . . . . . . . . . . . . . . . . . . . . . . . 248 In-Band Frequency Ranges. . . . . . . . . . . . . . . . . . . . . . . . . . . . . . . . . . . . . . . . . . . . . . . . . . . . . . . . . . . 248
28. iDEN/WiDEN/MotoTalk Measurement Application
Frequency and Time . . . . . . . . . . . . . . . . . . . . . . . . . . . . . . . . . . . . . . . . . . . . . . . . . . . . . . . . . . . . . . . . . 250
Amplitude Accuracy and Range. . . . . . . . . . . . . . . . . . . . . . . . . . . . . . . . . . . . . . . . . . . . . . . . . . . . . . . . . 251
Dynamic Range . . . . . . . . . . . . . . . . . . . . . . . . . . . . . . . . . . . . . . . . . . . . . . . . . . . . . . . . . . . . . . . . . . . 251
12

Contents
Application Specifications . . . . . . . . . . . . . . . . . . . . . . . . . . . . . . . . . . . . . . . . . . . . . . . . . . . . . . . . . . . . . 252
Measurements . . . . . . . . . . . . . . . . . . . . . . . . . . . . . . . . . . . . . . . . . . . . . . . . . . . . . . . . . . . . . . . . . . . . . 252
Parameter Setups . . . . . . . . . . . . . . . . . . . . . . . . . . . . . . . . . . . . . . . . . . . . . . . . . . . . . . . . . . . . . . . . . . 252
iDEN Power . . . . . . . . . . . . . . . . . . . . . . . . . . . . . . . . . . . . . . . . . . . . . . . . . . . . . . . . . . . . . . . . . . . . . . 252
iDEN Signal Demod . . . . . . . . . . . . . . . . . . . . . . . . . . . . . . . . . . . . . . . . . . . . . . . . . . . . . . . . . . . . . . . . 253
MotoTalk Signal Demod . . . . . . . . . . . . . . . . . . . . . . . . . . . . . . . . . . . . . . . . . . . . . . . . . . . . . . . . . . . . . 253
29. ISDB-T Measurement Application
Measurements . . . . . . . . . . . . . . . . . . . . . . . . . . . . . . . . . . . . . . . . . . . . . . . . . . . . . . . . . . . . . . . . . . . . . . 256 Channel Power . . . . . . . . . . . . . . . . . . . . . . . . . . . . . . . . . . . . . . . . . . . . . . . . . . . . . . . . . . . . . . . . . . . . 256 Channel Power with Shoulder Attenuation View . . . . . . . . . . . . . . . . . . . . . . . . . . . . . . . . . . . . . . . . . . 256 Power Statistics CCDF . . . . . . . . . . . . . . . . . . . . . . . . . . . . . . . . . . . . . . . . . . . . . . . . . . . . . . . . . . . . . . 256 Adjacent Channel Power . . . . . . . . . . . . . . . . . . . . . . . . . . . . . . . . . . . . . . . . . . . . . . . . . . . . . . . . . . . . 257 Spectrum Emission Mask . . . . . . . . . . . . . . . . . . . . . . . . . . . . . . . . . . . . . . . . . . . . . . . . . . . . . . . . . . . . 257 Modulation Analysis Settings . . . . . . . . . . . . . . . . . . . . . . . . . . . . . . . . . . . . . . . . . . . . . . . . . . . . . . . . . 259 Modulation Analysis Measurements. . . . . . . . . . . . . . . . . . . . . . . . . . . . . . . . . . . . . . . . . . . . . . . . . . . . 260 ISDB-T Modulation Analysis . . . . . . . . . . . . . . . . . . . . . . . . . . . . . . . . . . . . . . . . . . . . . . . . . . . . . . . . . 262 ISDB-Tmm Modulation Analysis . . . . . . . . . . . . . . . . . . . . . . . . . . . . . . . . . . . . . . . . . . . . . . . . . . . . . . 263
30. LTE Measurement Application
Supported Air Interface Features . . . . . . . . . . . . . . . . . . . . . . . . . . . . . . . . . . . . . . . . . . . . . . . . . . . . . . . . 266
Measurements . . . . . . . . . . . . . . . . . . . . . . . . . . . . . . . . . . . . . . . . . . . . . . . . . . . . . . . . . . . . . . . . . . . . . . . 267
Channel Power . . . . . . . . . . . . . . . . . . . . . . . . . . . . . . . . . . . . . . . . . . . . . . . . . . . . . . . . . . . . . . . . . . . . 267
Transmit On/Off Power. . . . . . . . . . . . . . . . . . . . . . . . . . . . . . . . . . . . . . . . . . . . . . . . . . . . . . . . . . . . . . 267
Adjacent Channel Power. . . . . . . . . . . . . . . . . . . . . . . . . . . . . . . . . . . . . . . . . . . . . . . . . . . . . . . . . . . . . 268
Occupied Bandwidth . . . . . . . . . . . . . . . . . . . . . . . . . . . . . . . . . . . . . . . . . . . . . . . . . . . . . . . . . . . . . . . . 269
Spectrum Emission Mask . . . . . . . . . . . . . . . . . . . . . . . . . . . . . . . . . . . . . . . . . . . . . . . . . . . . . . . . . . . . 269
Spurious Emissions . . . . . . . . . . . . . . . . . . . . . . . . . . . . . . . . . . . . . . . . . . . . . . . . . . . . . . . . . . . . . . . . . 269
Modulation Analysis . . . . . . . . . . . . . . . . . . . . . . . . . . . . . . . . . . . . . . . . . . . . . . . . . . . . . . . . . . . . . . . . 270
In-Band Frequency Range . . . . . . . . . . . . . . . . . . . . . . . . . . . . . . . . . . . . . . . . . . . . . . . . . . . . . . . . . . . . . 272
Operating Band, FDD . . . . . . . . . . . . . . . . . . . . . . . . . . . . . . . . . . . . . . . . . . . . . . . . . . . . . . . . . . . . . . . 272
Operating Band, TDD . . . . . . . . . . . . . . . . . . . . . . . . . . . . . . . . . . . . . . . . . . . . . . . . . . . . . . . . . . . . . . . 272
31. Multi-Standard Radio Measurement Application
Measurements . . . . . . . . . . . . . . . . . . . . . . . . . . . . . . . . . . . . . . . . . . . . . . . . . . . . . . . . . . . . . . . . . . . . . . . 274
Channel Power . . . . . . . . . . . . . . . . . . . . . . . . . . . . . . . . . . . . . . . . . . . . . . . . . . . . . . . . . . . . . . . . . . . . 274
Power Statistics CCDF . . . . . . . . . . . . . . . . . . . . . . . . . . . . . . . . . . . . . . . . . . . . . . . . . . . . . . . . . . . . . . 274
Occupied Bandwidth . . . . . . . . . . . . . . . . . . . . . . . . . . . . . . . . . . . . . . . . . . . . . . . . . . . . . . . . . . . . . . . . 274
Spurious Emissions . . . . . . . . . . . . . . . . . . . . . . . . . . . . . . . . . . . . . . . . . . . . . . . . . . . . . . . . . . . . . . . . . 275
Conformance EVM . . . . . . . . . . . . . . . . . . . . . . . . . . . . . . . . . . . . . . . . . . . . . . . . . . . . . . . . . . . . . . . . . 276
In-Band Frequency Range . . . . . . . . . . . . . . . . . . . . . . . . . . . . . . . . . . . . . . . . . . . . . . . . . . . . . . . . . . . . . 277
32. TD-SCDMA Measurement Application
Measurements . . . . . . . . . . . . . . . . . . . . . . . . . . . . . . . . . . . . . . . . . . . . . . . . . . . . . . . . . . . . . . . . . . . . . . . 280
Power vs. Time . . . . . . . . . . . . . . . . . . . . . . . . . . . . . . . . . . . . . . . . . . . . . . . . . . . . . . . . . . . . . . . . . . . . 280
Transmit Power . . . . . . . . . . . . . . . . . . . . . . . . . . . . . . . . . . . . . . . . . . . . . . . . . . . . . . . . . . . . . . . . . . . . 280
Adjacent Channel Power. . . . . . . . . . . . . . . . . . . . . . . . . . . . . . . . . . . . . . . . . . . . . . . . . . . . . . . . . . . . . 281
Single Carrier . . . . . . . . . . . . . . . . . . . . . . . . . . . . . . . . . . . . . . . . . . . . . . . . . . . . . . . . . . . . . . . . . . . . . 281
13

Contents
Power Statistics CCDF . . . . . . . . . . . . . . . . . . . . . . . . . . . . . . . . . . . . . . . . . . . . . . . . . . . . . . . . . . . . . . 282
Occupied Bandwidth. . . . . . . . . . . . . . . . . . . . . . . . . . . . . . . . . . . . . . . . . . . . . . . . . . . . . . . . . . . . . . . . 282
Spectrum Emission Mask . . . . . . . . . . . . . . . . . . . . . . . . . . . . . . . . . . . . . . . . . . . . . . . . . . . . . . . . . . . . 282
Spurious Emissions. . . . . . . . . . . . . . . . . . . . . . . . . . . . . . . . . . . . . . . . . . . . . . . . . . . . . . . . . . . . . . . . . 283
Code Domain . . . . . . . . . . . . . . . . . . . . . . . . . . . . . . . . . . . . . . . . . . . . . . . . . . . . . . . . . . . . . . . . . . . . . 283
Modulation Accuracy (Composite EVM). . . . . . . . . . . . . . . . . . . . . . . . . . . . . . . . . . . . . . . . . . . . . . . . 284
In-Band Frequency Range . . . . . . . . . . . . . . . . . . . . . . . . . . . . . . . . . . . . . . . . . . . . . . . . . . . . . . . . . . . . . 286
33. W-CDMA Measurement Application
Measurements. . . . . . . . . . . . . . . . . . . . . . . . . . . . . . . . . . . . . . . . . . . . . . . . . . . . . . . . . . . . . . . . . . . . . . . 288
Channel Power . . . . . . . . . . . . . . . . . . . . . . . . . . . . . . . . . . . . . . . . . . . . . . . . . . . . . . . . . . . . . . . . . . . . 288
Adjacent Channel Power . . . . . . . . . . . . . . . . . . . . . . . . . . . . . . . . . . . . . . . . . . . . . . . . . . . . . . . . . . . . 289
Power Statistics CCDF . . . . . . . . . . . . . . . . . . . . . . . . . . . . . . . . . . . . . . . . . . . . . . . . . . . . . . . . . . . . . . 291
Occupied Bandwidth. . . . . . . . . . . . . . . . . . . . . . . . . . . . . . . . . . . . . . . . . . . . . . . . . . . . . . . . . . . . . . . . 291
Spectrum Emission Mask . . . . . . . . . . . . . . . . . . . . . . . . . . . . . . . . . . . . . . . . . . . . . . . . . . . . . . . . . . . . 291
Spurious Emissions. . . . . . . . . . . . . . . . . . . . . . . . . . . . . . . . . . . . . . . . . . . . . . . . . . . . . . . . . . . . . . . . . 292
Code Domain . . . . . . . . . . . . . . . . . . . . . . . . . . . . . . . . . . . . . . . . . . . . . . . . . . . . . . . . . . . . . . . . . . . . . 293
QPSK EVM . . . . . . . . . . . . . . . . . . . . . . . . . . . . . . . . . . . . . . . . . . . . . . . . . . . . . . . . . . . . . . . . . . . . . . 294
Modulation Accuracy (Composite EVM). . . . . . . . . . . . . . . . . . . . . . . . . . . . . . . . . . . . . . . . . . . . . . . . 295
Power Control . . . . . . . . . . . . . . . . . . . . . . . . . . . . . . . . . . . . . . . . . . . . . . . . . . . . . . . . . . . . . . . . . . . . . 296
In-Band Frequency Range . . . . . . . . . . . . . . . . . . . . . . . . . . . . . . . . . . . . . . . . . . . . . . . . . . . . . . . . . . . . . 297
34. Single Acquisition Combined Fixed WiMAX Measurement Application
Measurements. . . . . . . . . . . . . . . . . . . . . . . . . . . . . . . . . . . . . . . . . . . . . . . . . . . . . . . . . . . . . . . . . . . . . . . 300 Transmit Power. . . . . . . . . . . . . . . . . . . . . . . . . . . . . . . . . . . . . . . . . . . . . . . . . . . . . . . . . . . . . . . . . . . . 300 Tx Output Spectrum . . . . . . . . . . . . . . . . . . . . . . . . . . . . . . . . . . . . . . . . . . . . . . . . . . . . . . . . . . . . . . . . 300 64QAM EVM . . . . . . . . . . . . . . . . . . . . . . . . . . . . . . . . . . . . . . . . . . . . . . . . . . . . . . . . . . . . . . . . . . . . . 301 In-Band Frequency Range for Warranted Specifications . . . . . . . . . . . . . . . . . . . . . . . . . . . . . . . . . . . . . 302
35. WLAN Measurement Application
Measurements . . . . . . . . . . . . . . . . . . . . . . . . . . . . . . . . . . . . . . . . . . . . . . . . . . . . . . . . . . . . . . . . . . . . . . 304 Channel Power . . . . . . . . . . . . . . . . . . . . . . . . . . . . . . . . . . . . . . . . . . . . . . . . . . . . . . . . . . . . . . . . . . . . 304 Power Statistics CCDF . . . . . . . . . . . . . . . . . . . . . . . . . . . . . . . . . . . . . . . . . . . . . . . . . . . . . . . . . . . . . . 306 Occupied Bandwidth. . . . . . . . . . . . . . . . . . . . . . . . . . . . . . . . . . . . . . . . . . . . . . . . . . . . . . . . . . . . . . . . 306 Power vs. Time . . . . . . . . . . . . . . . . . . . . . . . . . . . . . . . . . . . . . . . . . . . . . . . . . . . . . . . . . . . . . . . . . . . . 307 Spectrum Emission Mask . . . . . . . . . . . . . . . . . . . . . . . . . . . . . . . . . . . . . . . . . . . . . . . . . . . . . . . . . . . . 307 64QAM EVM . . . . . . . . . . . . . . . . . . . . . . . . . . . . . . . . . . . . . . . . . . . . . . . . . . . . . . . . . . . . . . . . . . . . . 313 CCK 11Mbps . . . . . . . . . . . . . . . . . . . . . . . . . . . . . . . . . . . . . . . . . . . . . . . . . . . . . . . . . . . . . . . . . . . . . 315
List Sequence Measurements . . . . . . . . . . . . . . . . . . . . . . . . . . . . . . . . . . . . . . . . . . . . . . . . . . . . . . . . . . . 316 Transmit Output Spectrum . . . . . . . . . . . . . . . . . . . . . . . . . . . . . . . . . . . . . . . . . . . . . . . . . . . . . . . . . . . 318 64QAM EVM . . . . . . . . . . . . . . . . . . . . . . . . . . . . . . . . . . . . . . . . . . . . . . . . . . . . . . . . . . . . . . . . . . . . . 323 CCK 11Mbps . . . . . . . . . . . . . . . . . . . . . . . . . . . . . . . . . . . . . . . . . . . . . . . . . . . . . . . . . . . . . . . . . . . . . 326 In-Band Frequency Range for Warranted Specifications . . . . . . . . . . . . . . . . . . . . . . . . . . . . . . . . . . . . . 327
14

Contents
15

Contents
16

Contents
17

Contents
18

|
1 |
Agilent EXA Signal Analyzer |
This chapter contains the specifications for the core signal analyzer. The specifications and characteristics for the measurement applications and options are covered in the chapters that follow.
19

Agilent EXA Signal Analyzer
Definitions and Requirements
Definitions and Requirements
This book contains signal analyzer specifications and supplemental information. The distinction among specifications, typical performance, and nominal values are described as follows.
Definitions
•Specifications describe the performance of parameters covered by the product warranty (temperature = 0 to 55°C1 also referred to as «Full temperature range» or «Full range», unless otherwise noted).
•95th percentile values indicate the breadth of the population (≈2σ) of performance tolerances expected to be met in 95% of the cases with a 95% confidence, for any ambient temperature in the range of 20 to 30°C. In addition to the statistical observations of a sample of instruments, these values include the effects of the uncertainties of external calibration references. These values are not warranted. These values are updated occasionally if a significant change in the statistically observed behavior of production instruments is observed.
•Typical describes additional product performance information that is not covered by the product warranty. It is performance beyond specification that 80% of the units exhibit with a 95% confidence level over the temperature range 20 to 30°C. Typical performance does not include measurement uncertainty.
•Nominal values indicate expected performance, or describe product performance that is useful in the application of the product, but is not covered by the product warranty.
Conditions Required to Meet Specifications
The following conditions must be met for the analyzer to meet its specifications.
•The analyzer is within its calibration cycle. See the General section of this chapter.
•Under auto couple control, except that Auto Sweep Time Rules = Accy.
•For signal frequencies < 10 MHz, DC coupling applied.
•Any analyzer that has been stored at a temperature range inside the allowed storage range but outside the allowed operating range must be stored at an ambient temperature within the allowed operating range for at least two hours before being turned on.
•The analyzer has been turned on at least 30 minutes with Auto Align set to Normal, or if Auto Align is set to Off or Partial, alignments must have been run recently enough to prevent an Alert message. If the Alert condition is changed from “Time and Temperature” to one of the disabled duration choices, the analyzer may fail to meet specifications without informing the user.
Certification
Agilent Technologies certifies that this product met its published specifications at the time of shipment from the factory. Agilent Technologies further certifies that its calibration measurements are traceable to the United States National Institute of Standards and Technology, to the extent allowed by the Institute’s calibration facility, and to the calibration facilities of other International Standards Organization members.
1. For earlier instruments (S/N prefix <MY/SG/US5052), the operating temperture ranges from 5 to 50°C
![]()
Agilent EXA Signal Analyzer
Frequency and Time
Frequency and Time
|
Description |
Specifications |
Supplemental Information |
||
Frequency Range |
||||
|
Maximum Frequency |
||||
|
Option 503 |
3.6 GHz |
|||
|
Option 507 |
7 GHz |
|||
|
Option 513 |
13.6 GHz |
|||
|
Option 526 |
26.5 GHz |
|||
|
Option 532 |
32 GHz |
|||
|
Option 544 |
44 GHz |
|||
|
Preamp Option P03 |
3.6 GHz |
|||
|
Preamp Option P07 |
7 GHz |
|||
|
Preamp Option P13 |
13.6 GHz |
|||
|
Preamp Option P26 |
26.5 GHz |
|||
|
Preamp Option P32 |
32 GHz |
|||
|
Preamp Option P44 |
44 GHz |
|||
|
Minimum Frequency |
||||
|
Preamp |
AC Coupleda |
DC Coupled |
||
|
Off |
10 MHz |
10 Hz |
||
|
On |
10 MHz |
100 kHz |
||
|
Harmonic |
LO Multiple (Nb) |
Band Overlapsc |
||
Band |
Mixing Mode |
|||
|
0 |
(10 Hz to 3.6 GHz) |
1− |
1 |
Options 503, 507, 513, 526, 532, |
|
544 |
||||
|
1 |
(3.5 GHz to 7 GHz) |
1− |
1 |
Option 507 |
|
1 |
(3.5 GHz to 8.4 GHz) |
1− |
1 |
Options 513, 526, 532, 544 |
|
2 |
(8.3 GHz to 13.6 GHz) |
1− |
2 |
Options 513, 526, 532, 544 |
|
3 |
(13.5 to 17.1 GHz) |
2− |
2 |
Options 526, 532, 544 |
|
4 |
(17.0 to 26.5 GHz) |
2− |
4 |
Options 526, 532, 544 |
|
5 |
(26.4 GHz to 32 GHz) |
2− |
4 |
Option 532 |
|
5 |
(26.4 GHz to 34.5 GHz) |
2− |
4 |
Option 544 |
|
6 |
(34.4 GHz to 44 GHz) |
4− |
8 |
Option 544 |
a.AC Coupled only applicable to Freq Options 503, 507, 513, and 526.
b.N is the LO multiplication factor. For negative mixing modes (as indicated by the “−” in the “Harmonic Mixing Mode” column), the desired 1st LO harmonic is higher than the tuned frequency by the 1st IF (5.1225 GHz for band 0, 322.5 MHz for all other bands).

Agilent EXA Signal Analyzer
Frequency and Time
c.In the band overlap regions, for example, 3.5 to 3.6 GHz, the analyzer may use either band for measurements, in this example Band 0 or Band 1. The analyzer gives preference to the band with the better overall specifications (which is the lower numbered band for all frequencies below 26 GHz), but will choose the other band if doing so is necessary to achieve a sweep having minimum band crossings. For example, with CF = 3.58 GHz, with a span of 40 MHz or less, the analyzer uses Band 0, because the stop frequency is 3.6 GHz or less, allowing a span without band crossings in the preferred band. If the span is between 40 and 160 MHz, the analyzer uses Band 1, because the start frequency is above
3.5 GHz, allowing the sweep to be done without a band crossing in Band 1, though the stop frequency is above 3.6 GHz, preventing a Band 0 sweep without band crossing. With a span greater than
160 MHz, a band crossing will be required: the analyzer sweeps up to 3.6 GHz in Band 0; then executes a band crossing and continues the sweep in Band 1.
Specifications are given separately for each band in the band overlap regions. One of these specifications is for the preferred band, and one for the alternate band. Continuing with the example from the previous paragraph (3.58 GHz), the preferred band is band 0 (indicated as frequencies under 3.6 GHz) and the alternate band is band 1 (3.5 to 8.4 GHz). The specifications for the preferred band are warranted. The specifications for the alternate band are not warranted in the band overlap region, but performance is nominally the same as those warranted specifications in the rest of the band. Again, in this example, consider a signal at 3.58 GHz. If the sweep has been configured so that the signal at
3.58 GHz is measured in Band 1, the analysis behavior is nominally as stated in the Band 1 specification line (3.5 to 8.4 GHz) but is not warranted. If warranted performance is necessary for this signal, the sweep should be reconfigured so that analysis occurs in Band 0. Another way to express this situation in this example Band 0/Band 1 crossing is this: The specifications given in the “Specifications” column which are described as “3.5 to 7.0 GHz” represent nominal performance from 3.5 to 3.6 GHz, and warranted performance from 3.6 to 7.0 GHz.
|
Description |
Specifications |
Supplemental |
|
|
Information |
|||
Standard Frequency Reference |
|||
|
Accuracy |
±[(time since last adjustment × |
||
|
aging rate) + temperature stability + |
|||
|
calibration accuracya] |
|||
|
Temperature Stability |
× 10−6 |
||
|
20 to 30°C |
±2 |
||
|
Full temperature range |
±2 |
× 10−6 |
|
|
Aging Rate |
±1 |
× 10−6/yearb |
|
|
Achievable Initial Calibration Accuracy |
±1.4 × 10⁻⁶ |
||
|
Settability |
±2 |
× 10−8 |
≤10 Hz × Nc p-p in |
|
Residual FM |
|||
|
(Center Frequency = 1 GHz |
20 ms (nominal) |
||
|
10 Hz RBW, 10 Hz VBW) |
|||
a.Calibration accuracy depends on how accurately the frequency standard was adjusted to 10 MHz. If the adjustment procedure is followed, the calibration accuracy is given by the specification “Achievable Initial Calibration Accuracy.”
b.For periods of one year or more.
c.N is the LO multiplication factor.

|
Agilent EXA Signal Analyzer |
||
|
Frequency and Time |
||
|
Description |
Specifications |
Supplemental |
|
Information |
||
Precision Frequency Reference |
||
|
(Option PFR) |
||
|
Accuracy |
±[(time since last adjustment |
|
|
× aging rate) + temperature |
||
|
stability + calibration |
||
|
accuracya]b |
||
|
Temperature Stability |
±1.5 × 10⁻⁸ |
Nominally linearc |
|
20 to 30°C |
||
|
Full temperature range |
±5 × 10⁻⁸ |
±5 × 10⁻¹⁰/day (nominal) |
|
Aging Rate |
||
|
Total Aging |
±1 × 10⁻⁷ |
|
|
1 Year |
||
|
2 Years |
±1.5 × 10⁻⁷ |
|
|
Settability |
±2 × 10⁻⁹ |
|
|
Warm-up and Retraced |
Nominal |
|
|
300 s after turn on |
±1 × 10⁻⁷ of final frequency |
|
|
900 s after turn on |
±1 × 10⁻⁸ of final frequency |
|
|
Achievable Initial Calibration Accuracye |
±4 × 10⁻⁸ |
|
|
Standby power to reference oscillator |
Not supplied |
|
|
Residual FM |
≤0.25 Hz × Nf p-p in 20 ms |
|
|
(Center Frequency = 1 GHz |
(nominal) |
|
|
10 Hz RBW, 10 Hz VBW) |
||
a.Calibration accuracy depends on how accurately the frequency standard was adjusted to 10 MHz. If the adjustment procedure is followed, the calibration accuracy is given by the specification “Achievable Initial Calibration Accuracy.”
b.The specification applies after the analyzer has been powered on for four hours.
c.Narrow temperature range performance is nominally linear with temperature. For example, for 25±3º C, the stability would be only three-fifths as large as the warranted 25±5º C, thus ±0.9 × 10⁻⁸.
d.Standby mode does not apply power to the oscillator. Therefore warm-up applies every time the power is turned on. The warm-up reference is one hour after turning the power on. Retracing also occurs every time warm-up occurs. The effect of retracing is included within the “Achievable Initial Calibration Accuracy” term of the Accuracy equation.
e.The achievable calibration accuracy at the beginning of the calibration cycle includes these effects:
1)Temperature difference between the calibration environment and the use environment
2)Orientation relative to the gravitation field changing between the calibration environment and the use environment
3)Retrace effects in both the calibration environment and the use environment due to turning the instrument power off.
4)Settability
f.N is the LO multiplication factor.

Agilent EXA Signal Analyzer
Frequency and Time
|
Description |
Specifications |
Supplemental |
|
Information |
||
Frequency Readout Accuracy |
±(marker freq × freq ref accy. + 0.25% |
Single detector onlyc |
|
× span + 5% × RBWa + 2 Hz + 0.5 × |
||
|
Example for EMCd |
horizontal resolutionb) |
|
|
±0.0032% (nominal) |
a.The warranted performance is only the sum of all errors under autocoupled conditions. Under non-autocoupled conditions, the frequency readout accuracy will nominally meet the specification
equation, except for conditions in which the RBW term dominates, as explained in examples below. The nominal RBW contribution to frequency readout accuracy is 2% of RBW for RBWs from 1 Hz to 390 kHz, 4% of RBW from 430 kHz through 3 MHz (the widest autocoupled RBW), and 30% of RBW for the (manually selected) 4, 5, 6 and 8 MHz RBWs.
First example: a 120 MHz span, with autocoupled RBW. The autocoupled ratio of span to RBW is 106:1, so the RBW selected is 1.1 MHz. The 5% × RBW term contributes only 55 kHz to the total frequency readout accuracy, compared to 300 kHz for the 0.0.25% × span term, for a total of 355 kHz. In this example, if an instrument had an unusually high RBW centering error of 7% of RBW (77 kHz) and a span error of 0.20% of span (240 kHz), the total actual error (317 kHz) would still meet the computed specification (355 kHz).
Second example: a 20 MHz span, with a 4 MHz RBW. The specification equation does not apply
because the Span: RBW ratio is not autocoupled. If the equation did apply, it would allow 50 kHz of error (0.25%) due to the span and 200 kHz error (5%) due to the RBW. For this non-autocoupled RBW, the RBW error is nominally 30%, or 1200 kHz.
b.Horizontal resolution is due to the marker reading out one of the sweep points. The points are spaced by span/(Npts –1), where Npts is the number of sweep points. For example, with the factory preset
value of 1001 sweep points, the horizontal resolution is span/1000. However, there is an exception: When both the detector mode is “normal” and the span > 0.25 × (Npts –1) × RBW, peaks can occur only in even-numbered points, so the effective horizontal resolution becomes doubled, or span/500 for the factory preset case. When the RBW is autocoupled and there are 1001 sweep points, that exception occurs only for spans > 750 MHz.
c.Specifications apply to traces in most cases, but there are exceptions. Specifications always apply to the peak detector. Specifications apply when only one detector is in use and all active traces are set to Clear Write. Specifications also apply when only one detector is in use in all active traces and the «Restart» key has been pressed since any change from the use of multiple detectors to a single detector. In other cases, such as when multiple simultaneous detectors are in use, additional errors of 0.5, 1.0 or 1.5 sweep points will occur in some detectors, depending on the combination of detectors in use.
d.In most cases, the frequency readout accuracy of the analyzer can be exceptionally good. As an example, Agilent has characterized the accuracy of a span commonly used for Electro-Magnetic Compatibility (EMC) testing using a source frequency locked to the analyzer. Ideally, this sweep would include
EMC bands C and D and thus sweep from 30 to 1000 MHz. Ideally, the analysis bandwidth would be 120 kHz at −6 dB, and the spacing of the points would be half of this (60 kHz). With a start frequency of 30 MHz and a stop frequency of 1000.2 MHz and a total of 16168 points, the spacing of points is
ideal. The detector used was the Peak detector. The accuracy of frequency readout of all the points tested in this span was with ±0.0032% of the span. A perfect analyzer with this many points would have an accuracy of ±0.0031% of span. Thus, even with this large number of display points, the errors in excess of the bucket quantization limitation were negligible.

|
Agilent EXA Signal Analyzer |
||
|
Frequency and Time |
||
|
Description |
Specifications |
Supplemental |
|
Information |
||
Frequency Countera |
See noteb |
|
|
Count Accuracy |
±(marker freq × freq ref accy. + 0.100 Hz) |
|
|
Delta Count Accuracy |
±(delta freq. × freq ref accy. + 0.141 Hz) |
|
|
Resolution |
0.001 Hz |
|
a.Instrument conditions: RBW = 1 kHz, gate time = auto (100 ms), S/N ≥ 50 dB, frequency = 1 GHz
b.If the signal being measured is locked to the same frequency reference as the analyzer, the specified count accuracy is ±0.100 Hz under the test conditions of footnote a. This error is a noisiness of the result. It will increase with noisy sources, wider RBWs, lower S/N ratios, and source frequencies > 1 GHz.
|
Description |
Specifications |
Supplemental |
||
|
Information |
||||
Frequency Span |
||||
|
Range |
||||
|
Option 503 |
0 |
Hz, 10 |
Hz to 3.6 GHz |
|
|
Option 507 |
0 Hz, 10 Hz to 7 GHz |
|||
|
Option 513 |
0 |
Hz, 10 |
Hz to 13.6 GHz |
|
|
Option 526 |
0 |
Hz, 10 |
Hz to 26.5 GHz |
|
|
Option 532 |
0 Hz, 10 Hz to 32 GHz |
|||
|
Option 544 |
0 Hz, 10 Hz to 44 GHz |
|||
|
Resolution |
2 |
Hz |
||
|
Span Accuracy |
±(0.25% × span + horizontal resolutiona) |
|||
|
Swept |
||||
|
FFT |
±(0.1% × span + horizontal resolutiona) |
a.Horizontal resolution is due to the marker reading out one of the sweep points. The points are spaced by span/(Npts − 1), where Npts is the number of sweep points. For example, with the factory preset
value of 1001 sweep points, the horizontal resolution is span/1000. However, there is an exception: When both the detector mode is “normal” and the span > 0.25 × (Npts − 1) × RBW, peaks can occur only in even-numbered points, so the effective horizontal resolution becomes doubled, or span/500 for the factory preset case. When the RBW is auto coupled and there are 1001 sweep points, that exception occurs only for spans > 750 MHz.

Agilent EXA Signal Analyzer
Frequency and Time
|
Description |
Specifications |
Supplemental Information |
Sweep Time and Trigger |
||
|
Sweep Time Range |
1 μs to 6000 s |
|
|
Span = 0 Hz |
||
|
Span ≥ 10 Hz |
1 ms to 4000 s |
|
|
Sweep Time Accuracy |
||
|
Span ≥ 10 Hz, swept |
±0.01% (nominal) |
|
|
Span ≥ 10 Hz, FFT |
±40% (nominal) |
|
|
Span = 0 Hz |
±0.01% (nominal) |
|
|
Sweep Trigger |
Free Run, Line, Video, |
|
|
External 1, External 2, RF |
||
|
Delayed Triggera |
Burst, Periodic Timer |
|
|
Range |
||
|
Span ≥ 10 Hz, swept |
0 to 500 ms |
|
|
Span = 0 Hz or FFT |
−150 ms to +500 ms |
|
|
Resolution |
0.1 μs |
|
a. Delayed trigger is available with line, video, RF burst and external triggers.

|
Agilent EXA Signal Analyzer |
||
|
Frequency and Time |
||
|
Description |
Specifications |
Supplemental Information |
Triggers |
Additional information on some of the |
|
|
triggers and gate sources |
||
|
Video |
Independent of Display Scaling and |
|
|
Reference Level |
||
|
Minimum settable level |
−170 dBm |
Useful range limited by noise |
|
Maximum usable level |
Highest allowed mixer levela + 2 dB |
|
|
(nominal) |
||
|
Detector and Sweep Type |
||
|
relationships |
||
|
Sweep Type = Swept |
||
|
Detector = Normal, Peak, |
Triggers on the signal before detection, |
|
|
Sample or Negative Peak |
which is similar to the displayed signal |
|
|
Detector = Average |
Triggers on the signal before detection, but |
|
|
with a single-pole filter added to give |
||
|
similar smoothing to that of the average |
||
|
detector |
||
|
Sweep Type = FFT |
Triggers on the signal envelope in a |
|
|
bandwidth wider than the FFT width |
||
|
RF Burst |
||
|
Level Range |
−50 to −10 dBm plus attenuation |
|
|
(nominal)b |
||
|
Level Accuracy |
±2 dB + Absolute Amplitude Accuracy |
|
|
(nominal) |
||
|
Bandwidth (−10 dB) |
16 MHz (nominal) |
|
|
Frequency Limitations |
If the start or center frequency is too close |
|
|
to zero, LO feedthrough can degrade or |
||
|
prevent triggering. How close is too close |
||
|
depends on the bandwidth listed above. |
||

Agilent EXA Signal Analyzer
Frequency and Time
|
Description |
Specifications |
Supplemental Information |
|
External Triggers |
See “Trigger Inputs” on page 72 |
|
|
TV Triggers |
Triggers on the leading edge of the selected |
|
|
sync pulse of standardized TV signals. |
||
|
Amplitude Requirements |
–65 dBm minimum video carrier power at |
|
|
the input mixer, nominal |
||
|
Compatible Standards |
NTSC-M, |
|
|
NTSC-Japan, |
||
|
NTSC-4.43, |
||
|
PAL-M, PAL-N, |
||
|
PAL-N Combination, |
||
|
PAL-B/-D/-G/-H/-I. |
||
|
PAL-60, SECAM-L |
||
|
Field Selection |
Entire Frame, Field |
|
|
One, Field Two |
||
|
Line Selection |
1 to 525, or 1 to 625, |
|
|
standard dependent |
||
a.The highest allowed mixer level depends on the IF Gain. It is nominally –10 dBm for Preamp Off and IF Gain = Low.
b.Noise will limit trigger level range at high frequencies, such as above 15 GHz.
|
Description |
Specifications |
Supplemental Information |
Gated Sweep |
||
|
Gate Methods |
Gated LO |
|
|
Gated Video |
||
|
Gated FFT |
||
|
Span Range |
Any span |
|
|
Gate Delay Range |
0 to 100.0 s |
|
|
Gate Delay Settability |
4 digits, ≥100 ns |
|
|
Gate Delay Jitter |
33.3 ns p-p (nominal) |
|
|
Gate Length Range |
100 ns to 5.0 s |
Gate length for the FFT method is fixed at |
|
(Except Method = FFT) |
1.83/RBW, with nominally 2% tolerance. |
|
|
Gated Frequency and |
Nominally no additional error for gated |
|
|
Amplitude Errors |
measurements when the Gate Delay is |
|
|
greater than the MIN FAST setting |
||
|
Gate Sources |
External 1 |
Pos or neg edge triggered |
|
External 2 |
||
|
Line |
||
|
RF Burst |
||
|
Periodic |
||

|
Agilent EXA Signal Analyzer |
||
|
Frequency and Time |
||
|
Description |
Specifications |
Supplemental Information |
|
Number of Frequency Sweep |
||
|
Points (buckets) |
||
|
Factory preset |
1001 |
|
|
Range |
1 to 40,001 |
Zero and non-zero spans |
Nominal Measurement Time vs. Span [Plot]

Agilent EXA Signal Analyzer
Frequency and Time
|
Description |
Specifications |
Supplemental |
||
|
Information |
||||
Resolution Bandwidth (RBW) |
||||
|
Range (−3.01 dB bandwidth) |
1 Hz to 8 MHz |
|||
|
Bandwidths above 3 MHz are 4, 5, |
||||
|
6, and 8 MHz. |
||||
|
Bandwidths 1 Hz to 3 MHz are |
||||
|
spaced at 10% spacing using the |
||||
|
E24 series (24 per decade): 1.0, 1.1, |
||||
|
1.2, 1.3, 1.5, 1.6, 1.8, 2.0, 2.2, 2.4, |
||||
|
2.7, 3.0, 3.3, 3.6, 3.9, 4.3, 4.7, 5.1, |
||||
|
5.6, 6.2, 6.8, 7.5, 8.2, 9.1 in each |
||||
|
Power bandwidth accuracya |
decade. |
|||
|
RBW Range |
CF Range |
|||
|
1 Hz to 750 kHz |
All |
±1.0% (0.044 dB) |
||
|
820 kHz to 1.2 MHz |
<3.6 GHz |
±2.0% (0.088 dB) |
||
|
1.3 to 2.0 MHz |
<3.6 GHz |
±0.07 dB (nominal) |
||
|
2.2 to 3 MHz |
<3.6 GHz |
±0.15 dB (nominal) |
||
|
4 to 8 MHz |
<3.6 GHz |
±0.25 dB (nominal) |
||
|
Noise BW to RBW ratiob |
1.056 ±2% (nominal) |
|||
|
Accuracy (−3.01 dB bandwidth)c |
±2% (nominal) |
|||
|
1 Hz to 1.3 MHz RBW |
||||
|
1.5 MHz to 3 MHz RBW |
||||
|
CF ≤ 3.6 GHz |
±7% (nominal) |
|||
|
CF > 3.6 GHz |
±8% (nominal) |
|||
|
4 MHz to 8 MHz RBW |
||||
|
CF ≤ 3.6 GHz |
±15% (nominal) |
|||
|
CF > 3.6 GHz |
±20% (nominal) |
|||
|
Selectivity (−60 dB/−3 dB) |
4.1:1 (nominal) |
|||
a.The noise marker, band power marker, channel power and ACP all compute their results using the power bandwidth of the RBW used for the measurement. Power bandwidth accuracy is the power uncertainty in the results of these measurements due only to bandwidth-related errors. (The analyzer knows this power bandwidth for each RBW with greater accuracy than the RBW width itself, and can therefore achieve lower errors.) The warranted specifications shown apply to the Gaussian RBW filters used in swept and zero span analysis. There are four different kinds of filters used in the spectrum analyzer: Swept Gaussian, Swept Flattop, FFT Gaussian and FFT Flattop. While the warranted performance only applies to the swept Gaussian filters, because only they are kept under statistical process control, the other filters nominally have the same performance.
b.The ratio of the noise bandwidth (also known as the power bandwidth) to the RBW has the nominal value and tolerance shown. The RBW can also be annotated by its noise bandwidth instead of this 3 dB bandwidth. The accuracy of this annotated value is similar to that shown in the power bandwidth accuracy specification.
![]()
Agilent EXA Signal Analyzer
Frequency and Time
c.Resolution Bandwidth Accuracy can be observed at slower sweep times than auto-coupled conditions.
Normal sweep rates cause the shape of the RBW filter displayed on the analyzer screen to widen by nominally 6%. This widening declines to 0.6% nominal when the Swp Time Rules key is set to Accuracy instead of Normal. The true bandwidth, which determines the response to impulsive signals and noise-like signals, is not affected by the sweep rate.
|
Description |
Specification |
Supplemental information |
Analysis Bandwidtha |
||
|
Standard |
10 MHz |
|
|
With Option B25b |
25 MHz |
|
|
With Option B40 |
40 MHz |
|
a.Analysis bandwidth is the instantaneous bandwidth available about a center frequency over which the input signal can be digitized for further analysis or processing in the time, frequency, or modulation domain.
b.Option B25 is standard for instruments ordered after May 1, 2011.
|
Description |
Specifications |
Supplemental Information |
|
Preselector Bandwidth |
Relevant to many options, such as B25 Wide IF |
||
|
Bandwidth, in Bands 1 and higher. Nominal. |
|||
|
Mean Bandwidth at CFa |
Freq option ≤ 526 |
Freq option > 526 |
|
|
5 GHz |
58 MHz |
46 MHz |
|
|
10 GHz |
57 MHz |
52 MHz |
|
|
15 GHz |
59 MHz |
53 MHz |
|
|
20 GHz |
64 MHz |
55 MHz |
|
|
25 GHz |
74 MHz |
56 MHz |
|
|
35 GHz |
62 MHz |
||
|
44 GHz |
70 MHz |
||
|
Standard Deviation |
9% |
7% |
|
|
–3 dB Bandwidth |
–7.5% relative to –4 dB bandwidth, nominal |
||
a.The preselector can have a significant passband ripple. To avoid ambiguous results, the –4 dB bandwidth is characterized.

Agilent EXA Signal Analyzer
Frequency and Time
|
Description |
Specifications |
Supplemental Information |
Video Bandwidth (VBW) |
||
|
Range |
Same as Resolution Bandwidth |
|
|
range plus wide-open VBW |
||
|
(labeled 50 MHz) |
||
|
Accuracy |
±6% (nominal) |
|
|
in swept mode and zero spana |
a.For FFT processing, the selected VBW is used to determine a number of averages for FFT results. That
number is chosen to give roughly equivalent display smoothing to VBW filtering in a swept measurement. For example, if VBW = 0.1 × RBW, four FFTs are averaged to generate one result.

Agilent EXA Signal Analyzer
Amplitude Accuracy and Range
Amplitude Accuracy and Range
|
Description |
Specifications |
Supplemental |
|
Information |
||
Measurement Range |
||
|
Preamp Off |
Displayed Average Noise Level to +23 dBm |
|
|
Preamp On |
Displayed Average Noise Level to +23 dBm |
Option P03, P07, P13, P26, |
|
P32, P44 |
||
|
Input Attenuation Range |
||
|
Standard |
0 to 60 dB, in 10 dB steps |
|
|
With Option FSA |
0 to 60 dB, in 2 dB steps |
|
|
Description |
Specifications |
Supplemental Information |
Maximum Safe Input Level |
Applies with or without preamp |
|
|
(Option P03, P07, P13, P26, P32, P44) |
||
|
Average Total Power |
+30 dBm (1 W) |
|
|
Peak Pulse Power |
+50 dBm (100 W) |
|
|
(≤10 μs pulse width, |
||
|
≤1% duty cycle, |
||
|
input attenuation ≥ 30 dB) |
||
|
DC voltage |
||
|
DC Coupled |
±0.2 Vdc |
|
|
AC Coupled |
±100 Vdc |
|
|
Description |
Specifications |
Supplemental |
|
Information |
||
Display Range |
||
|
Log Scale |
Ten divisions displayed; |
|
|
0.1 to 1.0 dB/division in 0.1 dB steps, and |
||
|
1 to 20 dB/division in 1 dB steps |
||
|
Linear Scale |
Ten divisions |
|

Agilent EXA Signal Analyzer
Amplitude Accuracy and Range
|
Description |
Specifications |
Supplemental Information |
Marker Readout |
||
|
Resolution |
||
|
Log (decibel) units |
||
|
Trace Averaging Off, on-screen |
0.01 dB |
|
|
Trace Averaging On or remote |
0.001 dB |
|
|
Linear units resolution |
≤1% of signal level (nominal) |
|

|
Agilent EXA Signal Analyzer |
|||||||
|
Amplitude Accuracy and Range |
|||||||
Frequency Response |
|||||||
|
Description |
Specifications |
Supplemental |
|||||
|
Information |
|||||||
|
Frequency Response |
Refer to the footnote for |
||||||
|
(Maximum error relative to |
Band Overlaps on page 21. |
||||||
|
reference condition (50 MHz) |
Freq Option 526 only: |
||||||
|
Mechanical attenuator onlyb |
Modes above 18 GHza |
||||||
|
Swept operationc |
|||||||
|
Attenuation 10 dB) |
|||||||
|
Option 532 or 544 (mmW) |
|||||||
|
Option 503, 507, 513, or 526 (RF/μW) |
20 to 30°C |
Full range |
95th Percentile (≈2σ) |
||||
|
9 kHz to 10 MHz |
x |
±0.8 dB |
±1.0 dB |
±0.40 dB |
|||
|
9 kHz to 10 MHz |
|||||||
|
x |
±0.6 dB |
±0.8 dB |
±0.28 dB |
||||
|
10 MHzd to 3.6 GHz |
x |
±0.6 dB |
±0.65 dB |
±0.21 dB |
|||
|
10 to 50 MHz |
|||||||
|
x |
±0.45 dB |
±0.57 dB |
±0.21 dB |
||||
|
50 MHz to 3.6 GHz |
x |
±0.45 dB |
±0.70 dB |
±0.20 dB |
|||
|
3.5 to 7 GHzef |
x |
±2.0 dB |
±3.0 dB |
±0.69 dB |
|||
|
3.5 to 5.2 GHzef |
|||||||
|
x |
±1.7 dB |
±3.5 dB |
±0.91 dB |
||||
|
5.2 to 8.4 GHzef |
x |
±1.5 dB |
±2.7 dB |
±0.61 dB |
|||
|
7 to 13.6 GHz |
x |
±2.5 dB |
±3.2 dB |
||||
|
8.3 to 13.6 GHzef |
|||||||
|
x |
±2.0 dB |
±2.7 dB |
±0.61 dB |
||||
|
13.5 to 22 GHzef |
x |
±3.0 dB |
±3.7 dB |
||||
|
13.5 to 17.1 GHzef |
|||||||
|
x |
±2.0 dB |
±2.7 dB |
±0.67 dB |
||||
|
17.0 to 22 GHzef |
x |
±2.0 dB |
±3.0 dB |
±0.78 dB |
|||
|
22.0 to 26.5 GHzef |
x |
±3.2 dB |
±4.2 dB |
||||
|
22.0 to 26.5 GHzef |
|||||||
|
x |
±2.5 dB |
±3.5 dB |
±0.72 dB |
||||
|
26.4 to 34.5 GHzef |
x |
±2.5 dB |
±3.5 dB |
±1.11 dB |
|||
|
34.4 to 44 GHzef |
x |
±3.2 dB |
±4.9 dB |
±1.42 dB |
a.Signal frequencies between 18 and 26.5 GHz are prone to additional response errors due to modes in the Type-N connector used with frequency Option 526. With the use of Type-N to APC 3.5 mm adapter part number 1250-1744, there are nominally six such modes. The effect of these modes with this connector are included within these specifications.
b.See the Electronic Attenuator (Option EA3) chapter for Frequency Response using the electronic attenuator.
c.For Sweep Type = FFT, add the RF flatness errors of this table to the IF Frequency Response errors. An additional error source, the error in switching between swept and FFT sweep types, is nominally ±0.01 dB and is included within the “Absolute Amplitude Error” specifications.
d.Specifications apply with DC coupling at all frequencies. With AC coupling, specifications apply at frequencies of 50 MHz and higher. Statistical observations at 10 MHz show that most instruments meet the specifications, but a few percent of instruments can be expected to have errors exceeding 0.5 dB at 10 MHz at the temperature extreme. The effect at 20 to 50 MHz is negligible, but not warranted.
e.Specifications for frequencies > 3.5 GHz apply for sweep rates ≤100 MHz/ms.

Agilent EXA Signal Analyzer
Amplitude Accuracy and Range
f. Preselector centering applied.
|
Description |
Specifications |
Supplemental Information |
||||
IF Frequency Responsea |
Modes above 18 GHzb |
|||||
|
(Demodulation and FFT |
||||||
|
response relative to the |
||||||
|
center frequency) |
||||||
|
Center |
Spanc |
Max Errord |
Midwidth Error |
Slope(dB/MHz) |
RMSf |
|
|
(95th |
||||||
|
Freq (GHz) |
(MHz) |
Preselector |
(Exceptione) |
(95th Percentile) |
Percentile) |
(nominal) |
|
<3.6 |
≤10 |
±0.40 dB |
±0.12 dB |
±0.10 |
0.04 dB |
|
|
≥3.6, ≤26.5 |
≤10 |
On |
0.25 dB |
|||
|
≥3.6 |
≤10 |
Offg |
±0.45 dB |
±0.12 dB |
±0.10 |
0.04 dB |
|
>26.5 |
≤10 |
On |
0.35 dB |
|||
a.The IF frequency response includes effects due to RF circuits such as input filters, that are a function of RF frequency, in addition to the IF passband effects.
b.Signal frequencies between 18 and 26.5 GHz are prone to additional response errors due to modes in the
Type-N connector used with frequency Option 526. With the use of Type-N to APC 3.5 mm adapter part number 1250-1744, there are nominally six such modes. These modes cause nominally up to −0.35 dB amplitude change, with phase errors of nominally up to ±1.2°.
c.This column applies to the instantaneous analysis bandwidth in use. In the Spectrum Analyzer Mode, this would be the FFT width.
d.The maximum error at an offset (f) from the center of the FFT width is given by the expression
± [Midwidth Error + (f × Slope)], but never exceeds ±Max Error. Here the Midwidth Error is the error at the center frequency for a given FFT span. Usually, the span is no larger than the FFT width in which case the center of the FFT width is the center frequency of the analyzer. When using the Spectrum Analyzer mode with an analyzer span is wider than the FFT width, the span is made up of multiple concatenated FFT results, and thus has multiple centers of FFT widths; in this case the f in the equation is the offset from the nearest center. Performance is nominally three times better at most center frequencies.
e.The specification does not apply for frequencies greater than 3.6 MHz from the center in FFT widths of 7.2 to 8 MHz.
f.The “rms” nominal performance is the standard deviation of the response relative to the center frequency, integrated across the span. This performance measure was observed at a center frequency in each harmonic mixing band, which is representative of all center frequencies; it is not the worst case frequency.
g.Option MPB is installed and enabled.

Agilent EXA Signal Analyzer
Amplitude Accuracy and Range
|
Description |
Specifications |
Supplemental Information |
|||
IF Phase Linearity |
Deviation from mean phase linearity |
||||
|
Modes above 18 GHza |
|||||
|
Span |
Peak-to-peak |
RMS (nominal)b |
|||
|
Center Freq (GHz) |
(MHz) |
Preselector |
(nominal) |
||
|
≥0.02, <3.6 |
≤10 |
n/a |
0.4° |
0.1° |
|
|
≥3.6, |
≤10 |
Offc |
0.4° |
0.1° |
|
|
≥3.6 (Option ≤ 526) |
≤10 |
On |
1.0° |
0.2° |
|
a.Signal frequencies between 18 and 26.5 GHz are prone to additional response errors due to modes in the
Type-N connector used with frequency Option 526. With the use Type-N to APC 3.5 mm adapter part number 1250-1744, there are nominally six such modes. These modes cause nominally up to −0.35 dB amplitude change, with phase errors of nominally up to ±1.2°.
b.The listed performance is the standard deviation of the phase deviation relative to the mean phase deviation from a linear phase condition, where the rms is computed across the span shown and over the range of center frequencies shown.
c.Option MPB is installed and enabled.
|
Description |
Specifications |
Supplemental Information |
Absolute Amplitude Accuracy |
||
|
At 50 MHza |
||
|
20 to 30°C |
±0.40 dB |
±0.15 dB (95th percentile) |
|
Full temperature range |
±0.43 dB |
|
|
At all frequenciesa |
||
|
20 to 30°C |
±(0.40 dB + frequency response) |
|
|
Full temperature range |
±(0.43 dB + frequency response) |
|
|
95th Percentile Absolute |
±0.27 dB |
|
|
Amplitude Accuracyb |
||
|
(Wide range of signal levels, |
||
|
RBWs, RLs, etc., |
||
|
0.01 to 3.6 GHz, |
||
|
Atten = 10 dB) |
||
|
Amplitude Reference Accuracy |
±0.05 dB (nominal) |
|
|
Preamp Onc |
±(0.39 dB + frequency |
|
|
response) (nominal) |
||

Agilent EXA Signal Analyzer
Amplitude Accuracy and Range
a.Absolute amplitude accuracy is the total of all amplitude measurement errors, and applies over the following subset of settings and conditions: 1 Hz ≤ RBW ≤ 1 MHz; Input signal −10 to −50 dBm (details below); Input attenuation 10 dB; span < 5 MHz (nominal additional error for span ≥ 5 MHz is
0.02 dB); all settings auto-coupled except Swp Time Rules = Accuracy; combinations of low signal level and wide RBW use VBW ≤ 30 kHz to reduce noise. When using FFT sweeps, the signal must be at the center frequency.
This absolute amplitude accuracy specification includes the sum of the following individual specifications under the conditions listed above: Scale Fidelity, Reference Level Accuracy, Display Scale Switching Uncertainty, Resolution Bandwidth Switching Uncertainty, 50 MHz Amplitude Reference Accuracy, and the accuracy with which the instrument aligns its internal gains to the 50 MHz Amplitude Reference.
The only difference between signals within the range ending at –50 dBm and those signals below that level is the scale fidelity. Our specifications show the possibility of increased errors below –80 dBm at the mixer, thus –70 dBm at the input. Therefore, one reasonably conservative approach to estimating the Absolute Amplitude Uncertainty below –70 dBm at the mixer would be to add an additional ±0.10 dB (the difference between the above –80 dBm at the mixer scale fidelity at the lower level scale fidelity) to the Absolute Amplitude Uncertainty.
b.Absolute Amplitude Accuracy for a wide range of signal and measurement settings, covers the 95th percentile proportion with 95% confidence. Here are the details of what is covered and how the computation is made:
The wide range of conditions of RBW, signal level, VBW, reference level and display scale are dis-
cussed in footnote a. There are 44 quasi-random combinations used, tested at a 50 MHz signal frequency. We compute the 95th percentile proportion with 95% confidence for this set observed over a statistically significant number of instruments. Also, the frequency response relative to the 50 MHz response is characterized by varying the signal across a large number of quasi-random verification fre-
quencies that are chosen to not correspond with the frequency response adjustment frequencies. We again compute the 95th percentile proportion with 95% confidence for this set observed over a statistically significant number of instruments. We also compute the 95th percentile accuracy of tracing the calibration of the 50 MHz absolute amplitude accuracy to a national standards organization. We also compute the 95th percentile accuracy of tracing the calibration of the relative frequency response to a national standards organization. We take the root-sum-square of these four independent Gaussian
parameters. To that rss we add the environmental effects of temperature variations across the 20 to 30°C range. These computations and measurements are made with the mechanical attenuator only in circuit, set to the reference state of 10 dB.
A similar process is used for computing the result when using the electronic attenuator under a wide range of settings: all even settings from 4 through 24 dB inclusive, with the mechanical attenuator set to 10 dB. Then the worst of the two computed 95th percentile results (they ere very close) is shown.
c.Same settings as footnote a, except that the signal level at the preamp input is −40 to −80 dBm. Total power at preamp (dBm) = total power at input (dBm) minus input attenuation (dB). This specification applies for signal frequencies above 100 kHz.

|
Agilent EXA Signal Analyzer |
||
|
Amplitude Accuracy and Range |
||
|
Description |
Specifications |
Supplemental Information |
Input Attenuation Switching Uncertainty |
Refer to the footnote for |
|
|
Band Overlaps on page 21 |
||
|
50 MHz (reference frequency) |
±0.20 dB |
±0.08 dB (typical) |
|
Attenuation > 2 dB, preamp off |
||
|
(Relative to 10 dB (reference setting)) |
||
|
9 kHz to 3.6 GHz |
±0.3 dB (nominal) |
|
|
3.5 to 7.0 GHz |
±0.5 dB (nominal) |
|
|
7.0 to 13.6 GHz |
±0.7 dB (nominal) |
|
|
13.5 to 26.5 GHz |
±0.7 dB (nominal) |
|
|
26.5 to 44 GHz |
±1.0 dB (nominal) |
|
|
Description |
Specifications |
Supplemental Information |
|
RF Input VSWR |
Nominala |
||
|
at tuned frequency, DC Coupled |
|||
|
10 dB attenuation, 50 MHz |
1.07:1 |
||
|
Input Attenuation |
|||
|
Frequency |
0 dB |
≥10 dB |
|
|
Option ≤526 |
|||
|
10 MHz to 3.6 GHz |
<2.2:1 |
<1.2:1 |
|
|
3.6 to 26.5 GHz |
<1.8:1 |
||
|
Option >526 |
|||
|
10 MHz to 3.6 GHz |
<2.2:1 |
<1.2:1 |
|
|
3.6 to 26.5 GHz |
<1.5:1 |
||
|
26.5 to 44 GHz |
<1.8:1 |
||
|
RF calibrator (e.g. 50 MHz) is On |
Open input |
||
|
Alignments running |
Open input for some, unless «All but RF» is |
||
|
selected |
|||
|
Preselector Centering |
Open input |
||
a. The nominal SWR stated is at the worst case RF frequency in three representative instruments.
|
Description |
Specifications |
Supplemental Information |
Resolution Bandwidth Switching Uncertainty |
Relative to reference BW of |
|
|
1.0 Hz to 3 MHz RBW |
±0.10 dB |
30 kHz |
|
Manually selected wide RBWs: 4, 5, 6, 8 MHz |
±1.0 dB |
|

Agilent EXA Signal Analyzer
Amplitude Accuracy and Range
|
Description |
Specifications |
Supplemental |
|
Information |
||
Reference Level |
||
|
Range |
||
|
Log Units |
−170 to +23 dBm, in 0.01 dB steps |
|
|
Linear Units |
707 pV to3.16 V, with 0.01 dB resolution (0.11%) |
|
|
Accuracy |
0 dBa |
a.Because reference level affects only the display, not the measurement, it causes no additional error in measurement results from trace data or markers.
|
Description |
Specifications |
Supplemental Information |
|
Display Scale Switching Uncertainty |
0 dBa |
|
|
Switching between Linear and Log |
||
|
Log Scale Switching |
0 dBa |
a.Because Log/Lin and Log Scale Switching affect only the display, not the measurement, they cause no additional error in measurement results from trace data or markers.
![]()
|
Agilent EXA Signal Analyzer |
||
|
Amplitude Accuracy and Range |
||
|
Description |
Specifications |
Supplemental Information |
Display Scale Fidelityab |
||
|
Absolute Log-Linear Fidelity |
||
|
(Relative to the reference condition: |
||
|
−25 dBm input through 10 dB |
||
|
attenuation, thus −35 dBm at the input |
||
|
mixer) |
||
|
Input mixer levelc |
Linearity |
|
|
−80 dBm ≤ ML ≤ −10 dBm |
±0.15 dB |
|
|
ML < −80 dBm |
±0.25 dB |
|
|
Relative Fidelityd |
Applies for mixer levelc range from |
|
|
−10 to −80 dBm, mechanical attenuator |
||
|
only, preamp off, and dither on. |
||
|
Sum of the following terms: |
Nominal |
|
|
high level term |
Up to ±0.045 dBe |
|
|
instability term |
Up to ±0.018 dB |
|
|
slope term |
From equationf |
|
|
prefilter term |
Up to ±0.005 dBg |
a.Supplemental information: The amplitude detection linearity specification applies at all levels below −10 dBm at the input mixer; however, noise will reduce the accuracy of low level measurements. The amplitude error due to noise is determined by the signal-to-noise ratio, S/N. If the S/N is large (20 dB or better), the amplitude error due to noise can be estimated from the equation below, given for the 3-sigma (three standard deviations) level.
3σ = 3(20dB)log 1 + 10–((S ⁄ N + 3dB) ⁄ 20dB)
The errors due to S/N ratio can be further reduced by averaging results. For large S/N (20 dB or better), the 3-sigma level can be reduced proportional to the square root of the number of averages taken.
b.The scale fidelity is warranted with ADC dither set to Medium. Dither increases the noise level by
nominally only 0.1 dB for the most sensitive case (preamp Off, best DANL frequencies). With dither Off, scale fidelity for low level signals, around −60 dBm or lower, will nominally degrade by 0.2 dB.
c.Mixer level = Input Level − Input Attenuation
d.The relative fidelity is the error in the measured difference between two signal levels. It is so small in many cases that it cannot be verified without being dominated by measurement uncertainty of the verification. Because of this verification difficulty, this specification gives nominal performance, based on numbers that are as conservatively determined as those used in warranted specifications. We will con-
sider one example of the use of the error equation to compute the nominal performance.
Example: the accuracy of the relative level of a sideband around −60 dBm, with a carrier at −5 dBm,
using attenuation = 10 dB, RBW = 3 kHz, evaluated with swept analysis. The high level term is evaluated with P1 = −15 dBm and P2 = −70 dBm at the mixer. This gives a maximum error within
±0.025 dB. The instability term is ±0.018 dB. The slope term evaluates to ±0.050 dB. The prefilter term applies and evaluates to the limit of ±0.005 dB. The sum of all these terms is ±0.098 dB.
e.Errors at high mixer levels will nominally be well within the range of ±0.045 dB × {exp[(P1 − Pref)/(8.69 dB)] − exp[(P2 − Pref)/(8.69 dB)]} (exp is the natural exponent function, ex). In this expres-
sion, P1 and P2 are the powers of the two signals, in decibel units, whose relative power is being measured. Pref is −10 dBm (−10 dBm is the highest power for which linearity is specified). All these levels are referred to the mixer level.

Agilent EXA Signal Analyzer
Amplitude Accuracy and Range
f.Slope error will nominally be well within the range of ±0.0009 × (P1 − P2). P1 and P2 are defined in footnote e.
g.A small additional error is possible. In FFT sweeps, this error is possible for spans under 4.01 kHz. For non-FFT measurements, it is possible for RBWs of 3.9 kHz or less. The error is well within the range of ±0.0021 × (P1 — P2) subject to a maximum of ±0.005 dB. (The maximum dominates for all but very small differences.) P1 and P2 are defined in footnote e.
|
Description |
Specifications |
Supplemental Information |
Available Detectors |
Normal, Peak, Sample, Negative Peak, |
Average detector works on RMS, |
|
Average |
Voltage and Logarithmic scales |
|

Agilent EXA Signal Analyzer
Dynamic Range
Dynamic Range
Gain Compression
|
Description |
Specifications |
Supplemental |
|
|
Information |
|||
|
1 dB Gain Compression Point |
Maximum power at |
||
|
(Two-tone)abc |
mixerd (nominal) |
||
|
20 MHz to 26.5 GHz (Option ≤526) |
+9 dBm (nominal) |
||
|
20 MHz to 26.5 GHz (Option >526) |
+6 dBm (nominal) |
||
|
26.5 to 44 GHz (Option >526) |
0 dBm (nominal) |
||
|
Clipping (ADC Over-range) |
|||
|
Any signal offset |
−10 dBm |
Low frequency |
|
|
exceptionsd |
|||
|
Signal offset > 5 times IF prefilter bandwidth |
+12 dBm (nominal) |
||
|
and IF Gain set to Low |
|||
|
IF Prefilter Bandwidth |
|||
|
Zero Span or |
Sweep Type = FFT, |
–3 dB Bandwidth |
|
|
Swept, RBW = |
FFT Width = |
(nominal) |
|
|
≤3.9 kHz |
<4.01 kHz |
8.9 kHz |
|
|
4.3 to 27 kHz |
<28.81 kHz |
79 kHz |
|
|
30 to 160 kHz |
<167.4 kHz |
303 kHz |
|
|
180 to 390 kHz |
<411.9 kHz |
966 kHz |
|
|
430 kHz to 8 MHz |
<7.99 MHz |
10.9 MHz |
|
a.Large signals, even at frequencies not shown on the screen, can cause the analyzer to incorrectly measure on-screen signals because of two-tone gain compression. This specification tells how large an interfering signal must be in order to cause a 1 dB change in an on-screen signal.
b.Specified at 1 kHz RBW with 100 kHz tone spacing. The compression point will nominally equal the specification for tone spacing greater than 5 times the prefilter bandwidth. At smaller spacings, ADC clipping may occur at a level lower than the 1 dB compression point.

Agilent EXA Signal Analyzer
Dynamic Range
c.Reference level and off-screen performance: The reference level (RL) behavior differs from some earlier analyzers in a way that makes this analyzer more flexible. In other analyzers, the RL controlled how the measurement was performed as well as how it was displayed. Because the logarithmic amplifier in these analyzers had both range and resolution limitations, this behavior was necessary for optimum measurement accuracy. The logarithmic amplifier in this signal analyzer, however, is implemented digitally such that the range and resolution greatly exceed other instrument limitations. Because of this, the analyzer can make measurements largely independent of the setting of the RL without compromising accuracy. Because the RL becomes a display function, not a measurement function, a marker can read out results that are off-screen, either above or below, without any change in accuracy. The only exception to the independence of RL and the way in which the measurement is performed is in the input attenuation setting: When the input attenuation is set to auto, the rules for the determination of the input attenuation include dependence on the reference level. Because the input attenuation setting controls the tradeoff between large signal behaviors (third-order intermodulation, compression, and display scale fidelity) and small signal effects (noise), the measurement results can change with RL changes when the input attenuation is set to auto.
d.The ADC clipping level declines at low frequencies (below 50 MHz) when the LO feedthrough (the signal that appears at 0 Hz) is within 5 times the prefilter bandwidth (see table) and must be handled by the ADC. For example, with a 300 kHz RBW and prefilter bandwidth at 966 kHz, the clipping level reduces for signal frequencies below 4.83 MHz. For signal frequencies below 2.5 times the prefilter bandwidth, there will be additional reduction due to the presence of the image signal (the signal that appears at the negative of the input signal frequency) at the ADC.

Agilent EXA Signal Analyzer
Dynamic Range

Agilent EXA Signal Analyzer
Dynamic Range
Displayed Average Noise Level
|
Description |
Specifications |
Supplemental |
|||||||
|
Information |
|||||||||
|
Displayed Average Noise Level |
Input terminated |
Refer to the footnote |
|||||||
|
(DANL)a |
Sample or Average detector |
for |
|||||||
|
Averaging type = Log |
Band Overlaps on |
||||||||
|
0 dB input attenuation |
page 21. |
||||||||
|
IF Gain = High |
|||||||||
|
1 Hz Resolution Bandwidth |
|||||||||
|
mmW without Option B40, DP2, or MPB |
|||||||||
|
mmW with Option B40, DP2, or MPB |
|||||||||
|
RF/μW(Option 503, 507, 513, or 526) |
|||||||||
|
20 to 30°C |
Full range |
Typical |
|||||||
|
10 Hz |
x |
x |
x |
–90 dBm (nominal) |
|||||
|
20 Hz |
x |
x |
x |
–100 dBm (nominal) |
|||||
|
100 Hz |
x |
x |
x |
–110 dBm (nominal) |
|||||
|
1 kHz |
x |
x |
x |
–120 dBm (nominal) |
|||||
|
9 kHz to 1 MHz |
x |
–125 dBm (nominal) |
|||||||
|
9 kHz to 1 MHz |
|||||||||
|
x |
x |
−130 dBm |
|||||||
|
1 to 10 MHzb |
x |
−147 dBm |
−145 dBm |
−149 dBm |
|||||
|
1 MHz to 1.2 GHz |
|||||||||
|
x |
x |
−152 dBm |
−151 dBm |
−155 dBm |
|||||
|
10 MHz to 2.1 GHz |
x |
−148 dBm |
−146 dBm |
−150 dBm |
|||||
|
1.2 to 2.1 GHz |
|||||||||
|
x |
x |
−151 dBm |
−150 dBm |
−154 dBm |
|||||
|
2.1 to 3.6 GHz |
x |
−147 dBm |
−145 dBm |
−149 dBm |
|||||
|
2.1 to 3.6 GHz |
|||||||||
|
x |
x |
−149 dBm |
−148 dBm |
−152 dBm |
|||||
|
3.6 to 7 GHz |
x |
−147 dBm |
−145 dBm |
−149 dBm |
|||||
|
3.5 to 4.2 GHz |
|||||||||
|
x |
−142 dBm |
−140 dBm |
−146 dBm |
||||||
|
3.5 to 4.2 GHz |
x |
−144 dBm |
−142 dBm |
−147 dBm |
|||||
|
4.2 to 8.4 GHz |
x |
−143 dBm |
−141 dBm |
−148 dBm |
|||||
|
4.2 to 8.4 GHz |
x |
−145 dBm |
−143 dBm |
−150 dBm |
|||||
|
7 to 13.6 GHz |
x |
−143 dBm |
−141 dBm |
−147 dBm |
|||||
|
8.3 to 13.6 GHz |
|||||||||
|
x |
−145 dBm |
−143 dBm |
−148 dBm |
||||||
|
8.3 to 13.6 GHz |
x |
−147 dBm |
−145 dBm |
−150 dBm |
|||||
|
13.5 to 22 GHz |
x |
−137 dBm |
−134 dBm |
−142 dBm |
|||||
|
13.5 to 20 GHz |
|||||||||
|
x |
−142 dBm |
−140 dBm |
−146 dBm |
||||||
|
13.5 to 20 GHz |
x |
−145 dBm |
−143 dBm |
−148 dBm |
|||||

Agilent EXA Signal Analyzer
Dynamic Range
|
Description |
Specifications |
Supplemental |
||||
|
Information |
||||||
|
22 to 26.5 GHz |
x |
−134 dBm |
−130 dBm |
−140 dBm |
||
|
20 to 26.5 GHz |
−137 dBm |
|||||
|
x |
−139 dBm |
−143 dBm |
||||
|
20 to 26.5 GHz |
x |
−142 dBm |
−140 dBm |
−145 dBm |
||
|
26.4 to 34 GHz |
x |
−137 dBm |
−133 dBm |
−142 dBm |
||
|
26.4 to 34 GHz |
x |
−140 dBm |
−136 dBm |
−144 dBm |
||
|
33.9 to 44 GHz |
x |
−131 dBm |
−127 dBm |
−137 dBm |
||
|
33.9 to 44 GHz |
x |
−135 dBm |
−131 dBm |
−140 dBm |
||
|
Additional DANL, IF Gain=Lowc |
x |
x |
x |
−160.5 dBm |
||
|
(nominal) |
||||||
a.DANL for zero span and swept is measured in a 1 kHz RBW and normalized to the narrowest available RBW, because the noise figure does not depend on RBW and 1 kHz measurements are faster.
b.DANL below 10 MHz is affected by phase noise around the LO feedthrough signal. Specifications
apply with the best setting of the Phase Noise Optimization control, which is to choose the “Best Close-in φ Noise» for frequencies below 25 kHz, and “Best Wide Offset φ Noise» for frequencies above 25 kHz.
c.Setting the IF Gain to Low is often desirable in order to allow higher power into the mixer without overload, better compression and better third-order intermodulation. When the Swept IF Gain is set to Low, either by auto coupling or manual coupling, there is noise added above that specified in this table for the IF Gain = High case. That excess noise appears as an additional noise at the input mixer. This level has sub-decibel dependence on center frequency. To find the total displayed average noise at the
mixer for Swept IF Gain = Low, sum the powers of the DANL for IF Gain = High with this additional DANL. To do that summation, compute DANLtotal = 10 × log (10^(DANLhigh/10) + 10^(AdditionalDANL / 10)). In FFT sweeps, the same behavior occurs, except that FFT IF Gain can be set to autorange, where it varies with the input signal level, in addition to forced High and Low settings.

Agilent EXA Signal Analyzer
Dynamic Range
Spurious Responses
|
Description |
Specifications |
Supplemental |
||
|
Information |
||||
|
Spurious Responses |
Preamp Offa |
|||
|
(see Band Overlaps on page 21) |
||||
|
Residual Responsesb |
−100 dBm |
|||
|
200 kHz to 8.4 GHz (swept) |
−100 dBm (nominal) |
|||
|
Zero span or FFT or other frequencies |
||||
|
Image Responses |
||||
|
Tuned Freq (f) |
Excitation Freq |
Mixer Levelc |
Response |
|
|
10 MHz to 26.5 GHz |
f+45 MHz |
−10 dBm |
−75 dBc |
−99 dBc (typical) |
|
10 MHz to 3.6 GHz |
f+10245 MHz |
−10 dBm |
−80 dBc |
−103 dBc (typical) |
|
10 MHz to 3.6 GHz |
f+645 MHz |
−10 dBm |
−80 dBc |
−107 dBc (typical) |
|
3.5 to 13.6 GHz |
f+645 MHz |
−10 dBm |
−75 dBc |
−87 dBc (typical) |
|
13.5 to 17.1 GHz |
f+645 MHz |
−10 dBm |
−71 dBc |
−85 dBc (typical) |
|
17.0 to 22 GHz |
f+645 MHz |
−10 dBm |
−68 dBc |
−82 dBc (typical) |
|
22 to 26.5 GHz |
f+645 MHz |
−10 dBm |
−66 dBc |
−78 dBc (typical) |
|
26.5 to 34.5 GHz |
f+645 MHz |
−30 dBm |
–70 dBc |
–94 dBc (typical) |
|
34.4 to 44 GHz |
f+645 MHz |
−30 dBm |
–60 dBc |
–79 dBc (typical) |
|
Other Spurious Responses |
||||
|
Carrier Frequency ≤26.5 GHz |
||||
|
First RF Orderd |
−10 dBm |
−68 dBc + |
Includes IF feedthrough, |
|
|
( f ≥ 10 MHz from carrier) |
20 × log(Ne) |
LO harmonic mixing |
||
|
Higher RF Orderf |
responses |
|||
|
−40 dBm |
−80 dBc + |
Includes higher order |
||
|
(f ≥ 10 MHz from carrier) |
20 × log(Ne) |
mixer responses |
||
|
Carrier Frequency >26.5 GHz |
||||
|
First RF Orderd |
−30 dBm |
–90 dBc (nominal) |
||
|
( f ≥ 10 MHz from carrier) |
||||
|
Higher RF Orderf |
−30 dBm |
–90 dBc (nominal) |
||
|
(f ≥ 10 MHz from carrier) |
−60 dBcg + |
|||
|
LO-Related Spurious Responses |
−10 dBm |
−90 dBc + 20 × log(N) |
||
|
(f > 600 MHz from carrier |
20 × log(Ne) |
(typical) |
||
|
10 MHz to 3.6 GHz) |
||||
|
Sidebands, offset from CW signal |
−70 dBcg (nominal) |
|||
|
≤200 Hz |
||||
|
200 Hz to 3 kHz |
−73 dBcg (nominal) |
|||
|
3 kHz to 30 kHz |
−73 dBc (nominal) |
|||
|
30 kHz to 10 MHz |
−80 dBc (nominal) |
|||

Agilent EXA Signal Analyzer
Dynamic Range
a.The spurious response specifications only apply with the preamp turned off. When the preamp is turned
on, performance is nominally the same as long as the mixer level is interpreted to be: Mixer Level = Input Level − Input Attenuation + Preamp Gain
b.Input terminated, 0 dB input attenuation.
c.Mixer Level = Input Level − Input Attenuation.
d.With first RF order spurious products, the indicated frequency will change at the same rate as the input, with higher order, the indicated frequency will change at a rate faster than the input.
e.N is the LO multiplication factor.
f.RBW=100 Hz. With higher RF order spurious responses, the observed frequency will change at a rate faster than the input frequency.
g.Nominally −40 dBc under large magnetic (0.38 Gauss rms) or vibrational (0.21 g rms) environmental stimuli.
Second Harmonic Distortion
|
Description |
Specifications |
Supplemental |
||||
|
Information |
||||||
|
Second Harmonic Distortion |
SHIa (nominal) |
|||||
|
Option 532, or 544 (mmW) |
||||||
|
Option 503, 507, 513, or 526 (RF/μW) |
||||||
|
+45 dBm |
||||||
|
10 MHz to 1.8 GHz |
x |
x |
||||
|
1.8 to 7 GHz |
x |
+65 dBm |
||||
|
1.8 to 6.5 GHz |
||||||
|
x |
+65 dBm |
|||||
|
7 to 11 GHz |
x |
+55 dBm |
||||
|
6.5 to 10 GHz |
||||||
|
x |
+60 dBm |
|||||
|
11 to 13.25 GHz |
x |
+50 dBm |
||||
|
10 to 13.25 GHz |
||||||
|
x |
+55 dBm |
|||||
|
13.25 to 22 GHz |
x |
+50 dBm |
||||
a.SHI = second harmonic intercept. The SHI is given by the mixer power in dBm minus the second harmonic distortion level relative to the mixer tone in dBc.

Agilent EXA Signal Analyzer
Dynamic Range
Third Order Intermodulation
|
Description |
Specifications |
Supplemental Information |
||||
|
Third Order |
Refer to the footnote for |
|||||
|
Intermodulation |
Band Overlaps on page 21. |
|||||
|
(Tone separation > 5 times IF |
||||||
|
Prefilter Bandwidtha |
||||||
|
Verification conditionsb) |
||||||
|
Option 532, or 544 (mmW) |
||||||
|
Option 503, 507, 513, or 526 (RF/μW) |
||||||
|
20 to 30°C |
Interceptc |
Intercept |
||||
|
(typical) |
||||||
|
10 to 100 MHz |
x |
+12 dBm |
+17 dBm |
|||
|
100 to 400 MHz |
x |
+10 dBm |
+14 dBm |
|||
|
400 MHz to 1.7 GHz |
x |
+11 dBm |
+15 dBm |
|||
|
1.7 to 3.6 GHz |
x |
+13 dBm |
+17 dBm |
|||
|
100 MHz to 3.95 GHz |
||||||
|
x |
+15 dBm |
+19 dBm |
||||
|
3.6 to 5.1 GHz |
x |
+11 dBm |
+17 dBm |
|||
|
5.1 to 7 GHz |
x |
+13 dBm |
+17 dBm |
|||
|
3.95 to 8.4 GHz |
||||||
|
x |
+15 dBm |
+18 dBm |
||||
|
7 to 13.6 GHz |
x |
+11 dBm |
+15 dBm |
|||
|
8.3 to 13.6 GHz |
||||||
|
x |
+15 dBm |
+18 dBm |
||||
|
13.6 to 26.5 GHz |
x |
+9 dBm |
+14 dBm |
|||
|
13.5 to 17.1 GHz |
||||||
|
x |
+11 dBm |
+17 dBm |
||||
|
17.0 to 26.5 GHz |
x |
+10 dBm |
+17 dBm (nominal) |
|||
|
26.5 to 44 GHz |
x |
+13 dBm (nominal) |
||||
|
Full temperature range |
||||||
|
10 to 100 MHz |
||||||
|
x |
+10 dBm |
|||||
|
100 to 400 MHz |
x |
+9 dBm |
||||
|
400 MHz to 1.7 GHz |
x |
+10 dBm |
||||
|
1.7 to 3.6 GHz |
x |
+12 dBm |
||||
|
100 MHz to 3.95 GHz |
||||||
|
x |
+13 dBm |
|||||
|
3.6 to 5.1 GHz |
x |
+10 dBm |
||||
|
5.1 to 7 GHz |
x |
+12 dBm |
||||
|
3.95 to 8.4 GHz |
||||||
|
x |
+13 dBm |
|||||
|
7 to 13.6 GHz |
x |
+10 dBm |
||||
|
8.3 to 13.6 GHz |
||||||
|
x |
+13 dBm |
|||||
 Loading…
-
Страница 1
Agilent X-Series Signal Analyzer N9010A EXA Specifications Guide (Compr ehensive Reference Data) This manual provides documentation for the following X-Series Analyzer: EXA Signal Analyzer N9010A[…]
-
Страница 2
Notices © Agilent T echnologies, Inc. 2007 — 20 10 No part of this manual may be reproduced in any form or by any means ( including electronic storage and retrieval or transla- tion into a foreign language) without prior agreement and written consent fro m Agi- lent T echnologies, Inc. as governed by United St at es and inte rna tional copyright l[…]
-
Страница 3
3 Notice Wa r r a n t y This Agilent technologies instrument product is warranted against defect s in material and workmanship for a period of one year from the date of shipment. Duri ng the warranty period, Agile nt T echnologies will, at its option, either repair or replace products that prove to be defective. For warranty service or repair , thi[…]
-
Страница 4
4[…]
-
Страница 5
Contents 5 1. Agilent EXA Sig nal Analyzer Definitions and Requirements . . . . . . . . . . . . . . . . . . . . . . . . . . . . . . . . . . . . . . . . . . . . . . . . . . . . . . . . . . . 14 Definitions . . . . . . . . . . . . . . . . . . . . . . . . . . . . . . . . . . . . . . . . . . . . . . . . . . . . . . . . . . . . . . . . . . . . . . . . .[…]
-
Страница 6
6 Contents Power Suite Measurements . . . . . . . . . . . . . . . . . . . . . . . . . . . . . . . . . . . . . . . . . . . . . . . . . . . . . . . . . . . . . 56 Channel Power . . . . . . . . . . . . . . . . . . . . . . . . . . . . . . . . . . . . . . . . . . . . . . . . . . . . . . . . . . . . . . . . . . . . . 56 Occupied Bandwidth. . . . . . . . […]
-
Страница 7
Contents 7 5. Option PFR — Precision Frequency Reference Specifications Affected by Preci sion Frequency Reference . . . . . . . . . . . . . . . . . . . . . . . . . . . . . . . . . . . . 10 0 6. I/Q Analyzer Specifications Affected by I/Q An alyzer: . . . . . . . . . . . . . . . . . . . . . . . . . . . . . . . . . . . . . . . . . . . . . . . . . . […]
-
Страница 8
8 Contents (EVM) . . . . . . . . . . . . . . . . . . . . . . . . . . . . . . . . . . . . . . . . . . . . . . . . . . . . . . . . . . . . . . . . . . . . . . . . . . . 136 Power vs. T ime . . . . . . . . . . . . . . . . . . . . . . . . . . . . . . . . . . . . . . . . . . . . . . . . . . . . . . . . . . . . . . . . . . . . 137 EDGE Power vs. T ime . […]
-
Страница 9
Contents 9 AM Rejection . . . . . . . . . . . . . . . . . . . . . . . . . . . . . . . . . . . . . . . . . . . . . . . . . . . . . . . . . . . . . . . . . . . . . 152 Residual PM . . . . . . . . . . . . . . . . . . . . . . . . . . . . . . . . . . . . . . . . . . . . . . . . . . . . . . . . . . . . . . . . . . . . . . 152 Measurement Range . . . . . […]
-
Страница 10
10 Contents Occupied Bandwidth. . . . . . . . . . . . . . . . . . . . . . . . . . . . . . . . . . . . . . . . . . . . . . . . . . . . . . . . . . . . . . . . 182 Spectrum Emission Mask . . . . . . . . . . . . . . . . . . . . . . . . . . . . . . . . . . . . . . . . . . . . . . . . . . . . . . . . . . . . 183 Spurious Emissions . . . . . . . . . . . […]
-
Страница 11
Contents 11 20. DVB-T/H Measur ement Application N6153A, DVB-T/H Measuremen ts Application . . . . . . . . . . . . . . . . . . . . . . . . . . . . . . . . . . . . . . . . . . . . 218 Channel Power . . . . . . . . . . . . . . . . . . . . . . . . . . . . . . . . . . . . . . . . . . . . . . . . . . . . . . . . . . . . . . . . . . . . 218 Channel Power[…]
-
Страница 12
12 Contents Frequency Points per Span . . . . . . . . . . . . . . . . . . . . . . . . . . . . . . . . . . . . . . . . . . . . . . . . . . . . . . . . . . . 248 Resolution Bandwidth (RBW) . . . . . . . . . . . . . . . . . . . . . . . . . . . . . . . . . . . . . . . . . . . . . . . . . . . . . . . . 248 Input . . . . . . . . . . . . . . . . . . . . .[…]
-
Страница 13
13 1 Agilent EXA Signal Analyzer This chapter contains the specifications for th e core signal analyzer . The specifications and characteristics for the me asurement applications and options are covered in the ch ap ters that follow .[…]
-
Страница 14
14 Chapter 1 Agilent EXA Si gnal Analyzer Definitions an d Req uirements Definitions and Requir ements This book cont ains signal analyzer sp ecifications and supplemental informatio n. The distinctio n amon g specifications, typical performance, and no minal values are described as follows . Definitions • Specifications describe the performance […]
-
Страница 15
Chapter 1 15 Agilent EXA Si gnal Analyzer Frequency and T ime Fr equency and T ime Description Specifications Supplemental I nformation Frequency Range Maximum Frequency Option 503 3.6 GHz Option 507 7 GHz Option 513 13.6 GH z Option 526 26.5 GH z Pr eamp Option P03 3.6 GHz Minimum Frequency Preamp AC Coupled DC Coupled Off 10 MHz 9 kHz On 10 MHz 1[…]
-
Страница 16
16 Chapter 1 Agilent EXA Si gnal Analyzer Freq uen cy and Ti me a. In the band o verlap regions, for example , 3.5 to 3.6 GHz, the analyzer may use either band for measurements, in this example Band 0 or Band 1. The analyzer gives pr eference to the band with the better overall specifications (which is the lower numbered ba nd for all frequencies b[…]
-
Страница 17
Chapter 1 17 Agilent EXA Si gnal Analyzer Frequency and T ime Achievable Initial Calibration Accuracy ± 1.4 × 10 − 6 Settabili ty ± 2 × 10 − 8 Residual FM Center Frequency = 1 GHz 10 Hz RBW , 10 Hz VBW ≤ 10 Hz × N p-p in 20 ms c , nominal a. Calibration accuracy d epe nds on how accura te ly the frequency standard was adjusted to 10 MHz.[…]
-
Страница 18
18 Chapter 1 Agilent EXA Si gnal Analyzer Freq uen cy and Ti me Description Specifications Supplemental Informat ion Prec ision Fr equency Refer ence ( Option PFR ) Accuracy ± [(time since last adjustment × aging rate) + temperature stability + calibration accuracy a ] b a. Calibration accuracy d epe nds on how accura te ly the frequency standard[…]
-
Страница 19
Chapter 1 19 Agilent EXA Si gnal Analyzer Frequency and T ime d. The achievable ca libration accuracy at the be ginning of the calibra tion cycle includes these effects: 1) T emperature difference between the calib ration environment and the use environment 2) Orientation relative to the gravitation fiel d changing between the calibration environme[…]
-
Страница 20
20 Chapter 1 Agilent EXA Si gnal Analyzer Freq uen cy and Ti me Description Specifications Supplemental Information Freq uen cy Read out Accuracy ± (marker freq. × freq. ref. accy . + 0.25 % × span + 5 % × RBW a + 2 Hz + 0.5 × horizontal resolut ion b ) a. The warranted performance is only the sum of all errors under autocoupled con ditions. U[…]
-
Страница 21
Chapter 1 21 Agilent EXA Si gnal Analyzer Frequency and T ime d. In most cases, the frequency read out accuracy of the ana lyzer can be exceptionally good. As an example, Agilent has characterized the accuracy of a span co mmonly used for Electro-Mag- netic Compatibility (EMC) testing using a source fre quency locked to the analyzer . Ideally , thi[…]
-
Страница 22
22 Chapter 1 Agilent EXA Si gnal Analyzer Freq uen cy and Ti me Description Specifications Supplemental Information Frequency Counter a a. Instrument conditions: RBW = 1 kHz, gate time = auto (100 ms), S /N ≥ 50 dB, frequency = 1 GHz See note b b. If the signal being measured is locked to the same frequency reference as the analyz er , the specif[…]
-
Страница 23
Chapter 1 23 Agilent EXA Si gnal Analyzer Frequency and T ime Description Specifications Supplemental Informatio n Sweep Time Range Span = 0 Hz Span ≥ 10 Hz 1 μ s to 6000 s 1 ms to 4000 s Accuracy Span ≥ 10 Hz, swept Span ≥ 10 Hz, FFT Span = 0 Hz ± 0.01 % (nominal) ± 40 % (nominal) ± 0.01 % (nominal) Sweep Trigger Free Run, Line, V ideo, […]
-
Страница 24
24 Chapter 1 Agilent EXA Si gnal Analyzer Freq uen cy and Ti me Sweep T ype = FFT T riggers on the signal envelope in a bandwidth wider than the FFT width RF Burst Level Range − 50 to − 10 dBm plus att enuati on (nominal) Bandwidth ( − 10 dB) Most cases 16 MHz (nominal) Sweep T ype = FFT ; FFT W idt h = 25 MHz; Span ≥ 8 MHz 30 MHz (nom inal[…]
-
Страница 25
Chapter 1 25 Agilent EXA Si gnal Analyzer Frequency and T ime Description Specifications Supplemental Informat ion Gated Sweep Gate Methods Gated LO Gated V id eo Gated FFT Span Range Any span Gate Delay Range 0 to 100.0 s Gate Delay Settability 4 digits, ≥ 100 ns Gate Dela y Jitter 33.3 ns p-p (nom inal) Gate Length Range Except Method = FFT 100[…]
-
Страница 26
26 Chapter 1 Agilent EXA Si gnal Analyzer Freq uen cy and Ti me Nominal Measur ement T ime vs. Span [Plot] Description Specifications Supplemental I nformation Number of Frequency Display T race Points (buckets) Factory preset 1001 Range 1 to 40,001 Zero and non-zero spans[…]
-
Страница 27
Chapter 1 27 Agilent EXA Si gnal Analyzer Frequency and T ime Description Specifications Supplemental Information Resolution Band width (RBW) Range ( − 3.01 dB bandwidth ) 1 Hz to 8 MHz Bandwidths above 3 MHz are 4, 5, 6, and 8 MHz. Bandwidths 1 Hz to 3 MHz are spaced at 10 % spacing using the E24 series (24 per decade): 1.0, 1. 1, 1.2, 1.3, 1.5,[…]
-
Страница 28
28 Chapter 1 Agilent EXA Si gnal Analyzer Freq uen cy and Ti me b. Resolution Bandwidth Accu racy can be observe d at slower sweep times than auto-coupled conditions. Normal sweep rates ca use the shape of the RBW filter displayed on the analyzer screen to widen by nominally 6 % . This widen ing declines to 0.6 % nominal when the Swp T ime Rules ke[…]
-
Страница 29
Chapter 1 29 Agilent EXA Si gnal Analyzer Amplitude Accuracy and Range Amplitude Accuracy and Range Description Specifications Supplemental Information Measurement Range Displayed A verage Noise Level to +23 dBm Preamp On Displayed A verage Noise Level to +23 dBm Option P03 Input Attenuation Range 0 to 60 dB, in 10 dB steps Standard Input Attenuati[…]
-
Страница 30
30 Chapter 1 Agilent EXA Si gnal Analyzer Amplitude Accuracy and Range Description Specifications Supplemental Information Marker Readout a a. Reference level and off-screen performance: Th e reference level (RL) behavior dif fers from some earlier analyzers in a way that makes this an alyzer more flexible. In other analyzers, the RL controlled how[…]
-
Страница 31
Chapter 1 31 Agilent EXA Si gnal Analyzer Amplitude Accuracy and Range Frequency Response Description Specifications Supplemental Information Frequency Re sponse Refer to the footnote for Band Overlaps on page 15 . Maximum error relative t o reference condition (50 MHz) Mechanical attenuator only a Swept operation b a. See the Electronic Attenuator[…]
-
Страница 32
32 Chapter 1 Agilent EXA Si gnal Analyzer Amplitude Accuracy and Range Description Specifications Supplemental Information IF Freq uency Response a a. The IF frequency response includes ef fects due to RF circuits such as input filters, that are a function of RF frequency , in add ition to the IF pass-band ef fects. Demodulation and FFT response re[…]
-
Страница 33
Chapter 1 33 Agilent EXA Si gnal Analyzer Amplitude Accuracy and Range Description Specifications Supplemental Information Input Attenuation Switching Uncertainty Refer to the footnote for Band Overlaps on page 15 . Relative to 10 dB (reference setting) Frequency Range 50 MHz (reference frequency) ± 0.20 dB ± 0.08 dB (typical) Attenuation > 2 […]
-
Страница 34
34 Chapter 1 Agilent EXA Si gnal Analyzer Amplitude Accuracy and Range Description Specificati ons Supplemental Informat ion Absolute Ampl itude Accuracy At 50 MHz a 20 to 30 ° C 5 to 50 ° C a. Absolute amplitude accuracy is the total of al l amplitude measurement e rrors, and applies over the following subset of sett ings and con ditions: 1 Hz ?[…]
-
Страница 35
Chapter 1 35 Agilent EXA Si gnal Analyzer Amplitude Accuracy and Range b. Absolute Amplitude Accuracy fo r a wide range of signal and measurement settings, covers the 95th percentile proportion with 95 % confiden ce. Here are the deta ils of what is covered and how the computation is made: The wide range of conditions of RBW , signal level, VBW , r[…]
-
Страница 36
36 Chapter 1 Agilent EXA Si gnal Analyzer Amplitude Accuracy and Range Description Specifications Supplemental Informat ion RF Input VS WR at tuned frequency , DC Coupled Nominal a a. The nominal SWR stated is the worst case RF frequency in three repr esentative instruments. 10 dB attenuation, 50 MHz 1.07:1 Input Attenuation Frequency 0 dB ≥ 10 d[…]
-
Страница 37
Chapter 1 37 Agilent EXA Si gnal Analyzer Amplitude Accuracy and Range Nominal VSW R [Plot][…]
-
Страница 38
38 Chapter 1 Agilent EXA Si gnal Analyzer Amplitude Accuracy and Range Description Specifications Supplemental Information Resolution Bandwidth Switching Uncertainty relative to reference BW of 30 kHz 1.0 Hz to 3 MHz RBW ± 0.10 dB Manually selected wide RBWs: 4, 5, 6, 8 MHz ± 1.0 dB Description Specifications Supplemental Information Reference Le[…]
-
Страница 39
Chapter 1 39 Agilent EXA Si gnal Analyzer Amplitude Accuracy and Range Description Specifications Supplemental I nformation Display Scale Switching Uncertainty Switching between Linear and Log 0 dB a a. Because Log/Lin and Log Scale Switching affect only the display , not the measurement, they cause no additional error in measurem ent results from […]
-
Страница 40
40 Chapter 1 Agilent EXA Si gnal Analyzer Amplitude Accuracy and Range a. Supplemental information: The amplitude detection linearity speci fication applies at all levels below − 10 dBm at the input mixer; however , nois e will reduce the accur acy of low level mea- surements. The amplitude error due to noise is determined by th e signal-to-noise[…]
-
Страница 41
Chapter 1 41 Agilent EXA Si gnal Analyzer Amplitude Accuracy and Range g. Slope error will nominally be well within the range of ± 0.0009 × (P1 − P2). P1 and P2 are defined in footnote f . h. A small additional error is possible. In FFT swee ps, this error is possible for spans under 4.01 kHz. For non-FFT measurements, it is possible for RBWs o[…]
-
Страница 42
42 Chapter 1 Agilent EXA Si gnal Analyzer Dynamic Range Dynamic Range Gain Compression Description Specifications Supplemental Informatio n 1 dB Gain Compression Point (T wo-tone) abc a. Lar ge signa ls, even at frequencies not shown on the screen, can cause the analyzer to incor- rectly measure on-screen signals because of two- tone gain compressi[…]
-
Страница 43
Chapter 1 43 Agilent EXA Si gnal Analyzer Dynamic Range c. Reference level and off-screen performance: Th e reference level (RL) behavior dif fers from some earlier analyzers in a way that makes this an alyzer more flexible. In other analyzers, the RL controlled how the measurement was perform ed as well as how it was displaye d. Because the logari[…]
-
Страница 44
44 Chapter 1 Agilent EXA Si gnal Analyzer Dynamic Range Displayed A verage Noise Level Description Specifications Supplemental Informat ion Displayed A verage Noise Level (DANL) a a. DANL for zero span and sw ept is normalized in two ways and for two reasons. DANL is mea- sured in a 1 kHz RBW and normalized to the na rrowest available RBW , because[…]
-
Страница 45
Chapter 1 45 Agilent EXA Si gnal Analyzer Dynamic Range c. Setting the IF Gain to Low is often desirable in order to allow higher power into the mixer without overload, better compression and better third-order intermodulation. When the Swept IF Gain is set to Low , either by auto co upling or manual coup ling, there is noise added above that speci[…]
-
Страница 46
46 Chapter 1 Agilent EXA Si gnal Analyzer Dynamic Range Spurious Responses Description Specifications Supplemental Information Spurious Responses Mixer Level a Response Preamp Off b Refer to the footnote for Band Overlaps on page 15 . Residual Responses c 200 kHz to 8.4 GHz (swept) Zero span or FFT or other frequencies N/A − 100 dBm − 100 dBm ([…]
-
Страница 47
Chapter 1 47 Agilent EXA Si gnal Analyzer Dynamic Range a. Mixer Level = Input Level − Input Attenuation. b. The spurious response specifications onl y apply with the preamp turned of f. When the pre amp is turned on, performance is nomi nally the same as long as the mixe r level is interpreted to be: Mixer Level = Input Level − Input Attenuati[…]
-
Страница 48
48 Chapter 1 Agilent EXA Si gnal Analyzer Dynamic Range Second Harmonic Distortion Third Order Intermodulation Distor tion Description Specifications Supplemental Informa tion Second Harmonic Distortion Mixer Leve l a a. Mixer level = Input Level − Input Attenuation SHI b (nominal) b. SHI = second harmonic intercep t. The SHI is given by the mixe[…]
-
Страница 49
Chapter 1 49 Agilent EXA Si gnal Analyzer Dynamic Range 400 MHz to 1.7 GHz +10 dBm − 80 dBc 1.7 to 3.6 GHz +12 dBm − 84 dBc 3.6 to 5.1 GHz +10 dBm − 80 dBc 5.1 to 7 GHz +12 dBm − 86 dBc 7 to 13.6 GHz +10 dBm − 80 dBc 13.6 to 26.5 GHz +7 dBm − 74 dBc a. See the IF Prefilter Bandwidth table in the Gain Compression specifications on page 4[…]
-
Страница 50
50 Chapter 1 Agilent EXA Si gnal Analyzer Dynamic Range Nominal Dynamic Range at 1 GHz [Plot][…]
-
Страница 51
Chapter 1 51 Agilent EXA Si gnal Analyzer Dynamic Range Nominal Dynamic Rang e Bands 1-4 [Plot][…]
-
Страница 52
52 Chapter 1 Agilent EXA Si gnal Analyzer Dynamic Range Nominal Dynamic Range vs. Offs et Frequency vs. RBW [Plot][…]
-
Страница 53
Chapter 1 53 Agilent EXA Si gnal Analyzer Dynamic Range Phase Noise Description Specifications Supplemental Information Phase Noise Noise Si debands Center Frequency = 1 GHz a Best-case Optimization b Internal Reference c a. The nominal performance of the phase noise at frequencies above the fre quency at which the specifications apply (1 GHz) depe[…]
-
Страница 54
54 Chapter 1 Agilent EXA Si gnal Analyzer Dynamic Range Nominal Phase Noise of Di fferent LO Opti mizations[…]
-
Страница 55
Chapter 1 55 Agilent EXA Si gnal Analyzer Dynamic Range Nominal Phase Noise at Di fferent Center Fr equencies[…]
-
Страница 56
56 Chapter 1 Agilent EXA Si gnal Analyzer Power Suite Measurements Power Suite Measurements Description Specifications Supplemental Information Channel Power Amplitude Accuracy Absolute Amplitude Accuracy a + Power Bandwidth Accuracy bc a. See “Absolute Amplitude A ccuracy” on page 34 . b. See “Frequency and T ime” on page 1 5 . c. Expresse[…]
-
Страница 57
Chapter 1 57 Agilent EXA Si gnal Analyzer Power Suite Measurements Description Specifications Supplemental Information Adjacent Channel Power (ACP) Case: Radio S td = None Accuracy of ACP Ratio (dBc) Display Scale Fideli ty a Accuracy of ACP Absolute Power (dBm or dBm/Hz) Absolute Amplitude Accuracy b + Power Bandwidth Accuracy cd Accuracy of Carri[…]
-
Страница 58
58 Chapter 1 Agilent EXA Si gnal Analyzer Power Suite Measurements On 5 M Hz Fil tered IBW − 73 dB − 8 dBm On 10 MHz Filtered IBW − 76 dB − 2 dBm RRC W eighting Accuracy n White noise in Adjacent Channel TOI-induced spectrum rms CW er ror 0.00 dB nominal 0.001 dB nominal 0.012 dB nominal a. The ef fect of scale fidelity on the ratio of tw o[…]
-
Страница 59
Chapter 1 59 Agilent EXA Si gnal Analyzer Power Suite Measurements i. T o meet this specified accurac y when measuring mobile s tation (MS) or user equipm ent (UE) within 3 dB of the required − 33 dBc ACPR, the mixer level (ML) must be optimized for accu- racy . This optimum mixer level is − 22 dBm, so the input att enua tion must be set as clo[…]
-
Страница 60
60 Chapter 1 Agilent EXA Si gnal Analyzer Power Suite Measurements n. 3GPP requires the use of a root-raised-cosine filter in evalua ting the ACLR of a device. The accuracy of the passband shape of the filter is not specified in standards, nor is any method of evaluating that accuracy . This f ootnote discusses the performance of the filter in this[…]
-
Страница 61
Chapter 1 61 Agilent EXA Si gnal Analyzer Power Suite Measurements Description Specifications Supplemental Information Case: Radio S t d = IS-95 or J-STD-008 Method RBW method a a. The RBW method measures the power in the adjacent channels within the defined resolution bandwidth. The noise bandwidth of the RBW f ilter is nominally 1.055 times the 3[…]
-
Страница 62
62 Chapter 1 Agilent EXA Si gnal Analyzer Power Suite Measurements c. As in footnote b , the specified ACPR accuracy applies if the ACPR measured substantially exceeds the analyzer dynamic range at the specified offset. Wh en this condition is not met, there are additional errors due to the addition of analyzer sp ectral components to UUT spec- tra[…]
-
Страница 63
Chapter 1 63 Agilent EXA Si gnal Analyzer Power Suite Measurements Description Specifications Supplemental Information Power S tatistics CCDF Histogram Resolution a a. The Complementary Cumulative Distribution Function (CCDF) is a reformatting of a histo- gram of the power envelope. The width of the amplitude bins used by the histogram is the his- […]
-
Страница 64
64 Chapter 1 Agilent EXA Si gnal Analyzer Power Suite Measurements Description Specifications Supplemental Information Spurious Emissions T able-driven spurious signals; search across regions Case: Radio S td = 3GPP W-CDMA Dynamic Range 1 to 3.6 GHz a a. The dynamic is specified with the mixer level at +3 dBm, where up to 1 dB of compression can oc[…]
-
Страница 65
Chapter 1 65 Agilent EXA Si gnal Analyzer Power Suite Measurements Case: Radio S t d = 3G PP W − CDMA Dynamic Range, rel a tiv e 2.515 MHz offset a d 76.5 dB 83.9 dB (typical) Sensitivity , absolute 2.515 MHz offset c − 94.7 dBm − 100.7 dBm (typical) Accuracy 2.515 MHz offset Relative d ± 0.12 dB Absolute e 20 to 30 °C ± 1.05 dB ± 0.34 dB[…]
-
Страница 66
66 Chapter 1 Agilent EXA Si gnal Analyzer Options Options The following options and applications af fect instrument specifications. Option 503: Frequency range, 9 kHz to 3.6 GHz Option 507: Frequency range, 9 kHz to 7 GHz Option 513: Frequency range, 9 kHz to 13.6 GHz Option 526: Frequency range, 9 kHz to 26.5 GHz Option B25: Analysis bandwidth , 2[…]
-
Страница 67
Chapter 1 67 Agilent EXA Si gnal Analyzer General General Description Specifications Supplemental Informat ion Calibration Cycle 1 year Description Specifications Supplemental Information T emperature Range Operating 5 to 50 ° CS t a n d a r d S torage − 40 to 65 ° C Altitude 3,000 meters (approx. 10,000 feet) Description Specifications Supplem[…]
-
Страница 68
68 Chapter 1 Agilent EXA Si gnal Analyzer General Acoustic Noise Emission/Geraeuschemis sion LpA <70 dB Operator position Normal position Per ISO 7779 LpA <70 dB Am Arbeitsplatz Normaler Betrieb Nach DIN 45635 t.19 Description Specifications Safety Complies w ith European Low V oltage Directive 2006/95/ EC — IEC/EN 6101 0-1 2nd Edition — […]
-
Страница 69
Chapter 1 69 Agilent EXA Si gnal Analyzer General Description Supplemental Information Measurement Speed a a. Sweep Points = 101. Nominal Standard w/ Option PC2 Local measurement and display update rate bc b. Factory preset, fixed center frequency , RBW = 1 MHz, span >10 MHz and ≤ 600 MHz, stop frequency ≤ 3.6 GHz, Auto Align Of f. c. Phase […]
-
Страница 70
70 Chapter 1 Agilent EXA Si gnal Analyzer General a. The LCD display i s manufactured using high precision technolog y . However , there may be up to six bright points (white, blue, red or gree n in color) that constan tly appear on the LCD screen. These points are normal in the manufa cturing process and do not affect the measure- ment integrity o[…]
-
Страница 71
Chapter 1 71 Agilent EXA Si gnal Analyzer Inputs/O utputs Inputs/Outputs Front Panel Description Specifications Supplemental Information RF Input Connector S tandard T ype-N female Impedance 50 Ω (nominal) Description Specifications Supplemental Information Probe Power V olta ge/Current +15 Vdc, ± 7 % at 150 mA max (nominal) − 12.6 Vdc, ± 10 %[…]
-
Страница 72
72 Chapter 1 Agilent EXA Si gnal Analyzer Inputs/Outputs Rear Panel Description Specifications Supplemental I nformation Headphone Jack Connector 3.5 mm (1/8 inch) miniature stereo audio jack Output Power 90 mW per chann el int o 16 Ω (nominal) Description Specifications Supplemental Information 10 MHz Out Connector BNC female Impedance 50 Ω (nom[…]
-
Страница 73
Chapter 1 73 Agilent EXA Si gnal Analyzer Inputs/O utputs Description Specifications Supplemental Information Sync Reserved for future use Connector BNC female Description Specifications Supplemental Information T rigger Inputs Either trigger source may be selected. T rigger 1 In, T rigger 2 In Connector BNC female Impedance 10 k Ω (nominal) T rig[…]
-
Страница 74
74 Chapter 1 Agilent EXA Si gnal Analyzer Inputs/Outputs Description Specifications Supplemental I nformation Noise Source Drive +28 V (Pulsed) Connector BNC female Description Specifications Supplemental Informat ion SNS Series Noise Source For use with Agilent T echnologies SNS Series noise sources Description Specifications Supplemental Informat[…]
-
Страница 75
Chapter 1 75 Agilent EXA Si gnal Analyzer Inputs/O utputs Description Specifications Supplemental Informat ion USB 2.0 Ports Master (4 ports) Connector USB T ype “A” (female) Output Curren t 0.5 A (nominal) Slave (1 port) Connector USB T ype “B” (female) Output Curren t 0.5 A (nominal) Description Specifications Supplemental Information GPI[…]
-
Страница 76
76 Chapter 1 Agilent EXA Si gnal Analyzer Regulatory Information Regulatory Information This product is designed for use in Installation Category II and Pol lution Degree 2 per IEC 61010 2n d ed, and 664 respectively . This product has been designed and tested in ac cord ance with accepted industry standards, and has been supplied in a safe conditi[…]
-
Страница 77
Chapter 1 77 Agilent EXA Si gnal Analyzer Declaration of Conformity Declaration of Conformity A copy of the Manufacturer ’ s European De claration of Conformity for this instrument can be obtained by contacting your local Agilent T echnologies sales representative.[…]
-
Страница 78
78 Chapter 1 Agilent EXA Si gnal Analyzer Declaration of Co nf ormity[…]
-
Страница 79
79 2 Option B25 (25 MHz) — Analysis Bandwidth This chapter contains specifications for the Op tion B25 (25 MHz) Analysis Bandwidth, an d fo r convenience, also has specifications for the standard bandwidt hs of 10 MHz and below .[…]
-
Страница 80
80 Chapter 2 Option B25 (25 MHz) — Analysis Bandwidth Specifications Affected by Analysis Bandwidth Specifications Affected by Analysis Bandwidth Specification Name Information IF Frequency Response Specifications presented in the core chapter ( “Agilent EXA Signal Analyzer” on page 13 ) are redundantly contained within this chapter . IF Phase […]
-
Страница 81
Chapter 2 81 Option B25 (25 MHz) — Analysis Bandwidth Other Analysis Band width Specifications Other Analysis Bandwidth Specifications Description Specification Supplemental Information IF Spurious Response, 25 MHz IF Bandwidth (Op ti on B25) a a. T o save test time, the levels of these sp urs are not warranted. However , the relationship between t[…]
-
Страница 82
82 Chapter 2 Option B25 (25 MHz) — Analysis Bandwidth Other Analysis Band width Specificatio ns Description Specifications Supplemental Informat ion SFDR (Spurious-Fr ee Dynamic Range) T est conditions a a. Signal level is –6 dB relative to dBfs wh ere: FS = –1 0 dBm at mixer , IF Gain = 0.. Signal Frequency wi thin ± 12 MHz of center –75 dB[…]
-
Страница 83
Chapter 2 83 Option B25 (25 MHz) — Analysis Bandwidth Other Analysis Band width Specifications Description Specification Supplemental I nformation IF Phase Linearity Relative to mean phase linearity Freq (GHz) Span (MHz) Peak (nominal) rms (nom inal) a a. The listed performance is the r .m.s. of the phase deviation relative to the a best-fit linear[…]
-
Страница 84
84 Chapter 2 Option B25 (25 MHz) — Analysis Bandwidth Other Analysis Band width Specificatio ns[…]
-
Страница 85
85 3 Option EA3 — Electr onic Attenuator , 3.6 GHz This chapter contains specifications for the Option EA3 Electronic Attenuator , 3.6 GHz.[…]
-
Страница 86
86 Chapter 3 Option EA3 — Electronic Attenuator , 3.6 GHz Specifications Affected by Electronic Attenuator Specifications Affected by Electronic Attenuator Specification Name Information Frequency Range See “Range (Frequency and Attenuation)” on page 87 . 1 dB Gain Compression Point See “Distortions and Noise” on page 88 . Displayed A verag[…]
-
Страница 87
Chapter 3 87 Option EA3 — Electr onic Attenu at or , 3.6 GHz Other Electronic Attenu ator Specificat ions Other Electr onic Attenuator Specifications Description Specifications Supplemental I nformation Range (Frequency and Attenuation) Frequency Range 9 kHz to 3.6 GHz Attenuation Range Electronic Attenuator Range 0 to 24 dB, 1 dB steps Calibrated […]
-
Страница 88
88 Chapter 3 Option EA3 — Electronic Attenuator , 3.6 GHz Other Electronic Attenuator Specifications Description Specifications Supplemental Information Distortions and Noise When using the electronic attenuator, the mechanical attenuator is also in-circuit. The full mechanical attenuator range is available a . a. The electronic attenuator is calib[…]
-
Страница 89
Chapter 3 89 Option EA3 — Electr onic Attenu at or , 3.6 GHz Other Electronic Attenu ator Specificat ions Description Specifications Supplemental Information Frequency Re sponse Maximum error relative t o reference condition (50 MHz) 20 to 30 ° C 5 to 50 ° C 95 th Percentile ( ≈ 2 σ ) Attenuation = 4 to 24 dB, even steps 9 kHz to 10 MHz ± 0.7[…]
-
Страница 90
90 Chapter 3 Option EA3 — Electronic Attenuator , 3.6 GHz Other Electronic Attenuator Specifications[…]
-
Страница 91
91 4 Option P03 — Pr eamplifier This chapter contains specificatio ns for the EXA S ignal Analyzer Option P03 preamplifier .[…]
-
Страница 92
92 Chapter 4 Option P03 — Preamplifier Specifications Affected by Preamp Specifications Affected by Pr eamp Specification Name Information Frequency Range See “Frequency Range” on page 15 of the core specifications. Nominal Dynami c Range vs. Offset Frequency vs. RBW Does not apply with Preamp On. Measurement Range The measurement range depends[…]
-
Страница 93
Chapter 4 93 Option P03 — Preamplifi er Other Preamp Specifications Other Pr eamp Specifications Description Specifications Supplemental I nformation Preamp ( Option P03) a a. The preamp follows the i nput attenuator , AC/DC coupling switch, and precedes the input mixer . In low-band, it follows the 3.6 GHz low-pass filter . Gain Maximum b b. Pream[…]
-
Страница 94
94 Chapter 4 Option P03 — Preamplifier Other Preamp Specifications Description Specifications Supplemental Information 1 dB Gain Compression Point (T wo-tone) ab a. Large signals, even at frequencies not shown on the screen, can cause the analyzer to mismeasure on-screen signals because of two-to ne gain compression. This specification tells how la[…]
-
Страница 95
Chapter 4 95 Option P03 — Preamplifi er Other Preamp Specifications Description Specifications Supplement al Information Displayed A verage Noise Level (DANL) − Preamp On (Option P03) a a. DANL for zero span and swep t is normalized in two way s and for two reasons. DANL is measured in a 1 kHz RBW and normalized to the narrowest available RBW , b[…]
-
Страница 96
96 Chapter 4 Option P03 — Preamplifier Other Preamp Specifications Description Specifications Supplemental Info rmation Frequency Re sponse − Preamp On (Option P03) Refer to the footnote for Band Overlaps o n page 15 . Maximum error relative t o reference condition (50 MHz) Input attenuation 0 dB Swept operation a a. For Sweep T ype = FFT , add t[…]
-
Страница 97
Chapter 4 97 Option P03 — Preamplifi er Other Preamp Specifications Nominal VSWR − Preamp On (Plot) Description Specifications Supplemental Information Third Order Intermodulat ion Distort ion T one separation 5 times IF Prefilter Bandwidth a a. See the IF Prefilter Bandwidth table in the specifications for “Gain Compression” on page 42 . Whe[…]
-
Страница 98
98 Chapter 4 Option P03 — Preamplifier Other Preamp Specifications Nominal Dynamic Range at 1 GHz, Preamp On (Plot)[…]
-
Страница 99
99 5 Option PFR — Pr ecision Fr equency Refer ence This chapter contains specifications for th e Option PFR Precision Frequency Reference.[…]
-
Страница 100
100 Chapter 5 Option PFR — Precision Frequency Reference Specifications Affected by Precision Fr equency Refer ence Specifications Affected by Pr ecision Fr equency Reference Specification Name Information Precision Frequency Reference See “Precision Frequency Reference” on page 18 in the core specific ations.[…]
-
Страница 101
101 6 I/Q Analyzer This chapter contains specifications for the I/Q Analyzer measurement application (Basic Mode).[…]
-
Страница 102
102 Chapter 6 I/Q Analyzer Specifications Affect ed by I/Q Analyzer: Specifications Affected by I/Q Analyzer: Specification Name Information Number of Frequency Display T race Points (buckets) Does not apply . Resolution Bandwidth See “Frequency” on page 103 in this chapter . V ideo Bandwidth N ot avail a ble. Clipping-to-Noise Dynamic Range Se[…]
-
Страница 103
Chapter 6 103 I/Q Analyzer Freque ncy Fr equency Description Specifications Supplemental Information Freq uen cy Span S tandard instrument 10 Hz to 10 MHz Option B25 10 Hz to 25 MHz Resolution Bandwidth (Spectrum Measurement) Range Overall Span = 1 MHz Span = 10 kHz Span = 100 Hz 100 mHz to 3 MHz 50 Hz to 1 MHz 1 Hz to 10 kHz 100 mHz to 10 0 Hz W i[…]
-
Страница 104
104 Chapter 6 I/Q Analyzer Frequen cy Description Specifications Supplemental In formation Clipping-to-Noise Dynamic Range a a. This specification is defined to be the ratio of the clipping lev el (also known as “ADC Over Ran ge”) to the noise density . In decibel units, it can be defined as clipping_l evel [dBm] − noise_density [dBm/Hz]; the[…]
-
Страница 105
Chapter 6 105 I/Q Analyzer Data Acquisition Data Acquisition Description Specifications Supplemental Information Time Record Length 4,000,000 sam ples (max) 4,000,000 samples ≈ 88.89 ms at 25 MHz span Sample Rate 90 MSa/s for 25 MHz ADC Resolutio n 14 Bits[…]
-
Страница 106
106 Chapter 6 I/Q Analyzer Data Acquisit ion[…]
-
Страница 107
107 7 Phase Noise Measur ement Application This chapter contains specifications for the N9068A Phase Noise measurement application.[…]
-
Страница 108
108 Chapter 7 Phase Noise Measurement Application General Specifications General Specifications Description Specifications Supplemental I nformation Maximum Carrier Fr equency EXA Signal Analyzers Option 503 3.6 GHz Option 507 7 GHz Option 513 13.6 GHz Option 526 26.5 GHz Description Specifications Supplemental Information Measurement Characteristi[…]
-
Страница 109
Chapter 7 109 Phase Noise Measurement Application General Specifications Description Specifications Supplemental Informat ion Measurement Accuracy Phase Noise Density Accuracy a b Default settings c Overdrive On setting a. This does not include the ef fect of system noise floo r . This error is a fu nction of the signal (phase noise of the DUT) to […]
-
Страница 110
11 0 Chapter 7 Phase Noise Measurement Application General Specifications Description Specifications Supplemental Information Amplitude R epeatability Standard Deviation a b a. Amplitude repeatabilit y is the nominal stan dard de viation of the measured phase noise. This table comes from an observat ion of 30 log plot measurements using a 1 GHz, 0 […]
-
Страница 111
Chapter 7 111 Phase Noise Measurement Application General Specifications Description Specifications Supplemental Inf ormation Offset Frequency Range 3 Hz to ( ƒ opt − ƒ CF ) Hz ƒ opt : Maximum frequency determined by optio n a ƒ CF : Carrier frequency of signal under test a. For example, ƒ opt is 3.6 GHz for Option 503 . Accuracy b b. The fr[…]
-
Страница 112
11 2 Chapter 7 Phase Noise Measurement Application General Specifications[…]
-
Страница 113
11 3 8 802.16 OFDMA Measur ement Application This chapter contains specifications for the N9075A 802. 16 OFDMA measurement application. Additional Definitions and Requirement s Because digital communications si gnals are noise-like, all measurem ents will have variations. The specifications apply only with adequate averaging to rem ove those variat[…]
-
Страница 114
11 4 Chapter 8 802.16 OFDMA Measurement Appli cation Measurement Specifications Measurement Specifications Description Specifications Supplemental Information Channel Power Minimum power at RF Input − 30 dBm (n ominal) Absolute power accuracy a a. Absolute power accuracy includes all error sources for in-band signals except mismatch errors and re[…]
-
Страница 115
Chapter 8 11 5 802.16 OFDMA Measurement Application Measurement Specifications Minimum power at RF Input − 36 dBm (nominal) ACPR Accuracy Radio BW Offset MS 5 MHz 5 MHz ± 0.10 dB At ACPR − 24 dBc with optimum mixer level a MS 5 MHz 10 MHz ± 0.45 dB At ACPR − 47 dBc with optimum mixer level b MS 10 MHz 10 MHz ± 0.17 dB At ACPR − 24 dBc wi[…]
-
Страница 116
11 6 Chapter 8 802.16 OFDMA Measurement Appli cation Measurement Specifications e. T o meet this specified accuracy when measuring bas e station (BS) at − 45 dBc ACPR, the mixer level (ML) must be optimized for accur acy . This optimum mixer level is − 18 dBm, so the input attenuatio n must be set as close as possible to the average i nput powe[…]
-
Страница 117
Chapter 8 11 7 802.16 OFDMA Measurement Application Measurement Specifications Description Specifications Supplemental Information Spectrum Emission Mask Dynamic Range, rel a tiv e 5.05 MHz offset 10 MHz BW a b a. The dynamic range specification is the ratio of the channel pow er to the power in the offset specified. The dynamic range depends on th[…]
-
Страница 118
11 8 Chapter 8 802.16 OFDMA Measurement Appli cation Measurement Specifications Frequency Description Specifications Supplemental Information Spurious Emissions Accuracy Attenuation = 10 dB Frequency Range 9 kHz to 3.6 GHz ± 0.38 dB (95 th percentile) 3.5 GHz to 8.4 GHz ± 1.22 dB (95 th percentile) 8.3 GHz to 13.6 GHz ± 1.59 dB (95 th percentile[…]
-
Страница 119
11 9 9 W -CDMA Measur ement Application This chapter contains specifications for the N9073A W — CDMA measurement application. It contains both N9073A-1FP W — CDMA and N907 3A-2FP HSDP A/HSUP A me asurement applications. Additional Definitions and Requirement s Because digital communications si gnals are noise-like, all measurem ents will have varia[…]
-
Страница 120
120 Chapter 9 W -CDMA Measurement Application Conformance with 3GPP TS 25.141 Base S tati on Requirements Conformance with 3GPP TS 25.141 Base S tation Requir ements Sub- clause Name 3GPP Requir ed T est Instrument T olerance (as of 2006-03) Instrument T olerance Interval abc Supplemental Information S t an da rd sections (Measurement Name) 6.2.1 M[…]
-
Страница 121
Chapter 9 121 W -CDMA Measurement Application Conformance with 3GPP TS 25.141 Base S tation Requirements 6.7.3 T ime alignment error in Tx Diversity (Modulation Accuracy) ± 26 ns (95%) [= 0.1 T c] ± 1.25 ns (100%) a. Those tolerances marked as 95% are derived from 95th percentile observat ions with 95% confidence. b. Those tolerances marked as 10[…]
-
Страница 122
122 Chapter 9 W -CDMA Measurement Application Amplitude Amplitude Description Specifications Supplemental Information Channel Power Minimum power at RF Input − 50 dBm (n ominal) Absolute power accuracy a 20 to 30 °C Atten = 10 dB a. Absolute power accuracy includes all error sources for in-band signals except mismatch errors and repeatability du[…]
-
Страница 123
Chapter 9 123 W -CDMA Measurement Application Amplitude Description Specifications Supplemental Information Adjacent Channel Power (ACPR; ACLR) Single Carrier Minimum power at RF Input − 36 dBm (nominal) ACPR Accuracy a a. The accuracy of the Adjacent Channel Power Ratio will depend on the m ixer drive level and whether the distortion p roducts f[…]
-
Страница 124
124 Chapter 9 W -CDMA Measurement Application Amplitude b. The Fast method has a slight decrease in accuracy in only one case: for BTS measurements at 5 MHz offset, the accuracy degrades by ± 0.01 dB relative to the accuracy shown in this table. c. T o meet this specified accuracy when measuring mobile station (MS) or user equipment (UE) within 3 […]
-
Страница 125
Chapter 9 125 W -CDMA Measurement Application Amplitude Fast ACPR T est a a. Observation conditions for ACP speed: Display Off, signal is T est Model 1 with 64 DPCH, Method set to Fast. Measured with an IBM compat- ible PC with a 3 GHz Pen tium 4 running W indows XP Professional V ersion 2002. The com munications medium was PCI-GPIB IEEE 488.2. T h[…]
-
Страница 126
126 Chapter 9 W -CDMA Measurement Application Amplitude Description Specifications Supplemental Information Power S tatistics CCDF Histogram Resolution 0.01 dB a a. The Complementary Cumulative Distribu tion Function (CCDF) is a reformatt ing of the histo gram of the power envelope. The width of the amplitu de bins used by the histogram is the hist[…]
-
Страница 127
Chapter 9 127 W -CDMA Measurement Application Amplitude c. The sensitivity is specified with 0 dB input atten uati on. It represents the noise lim itati ons of the ana- lyzer . It is tested without an input signal. The sensitivity at thi s offset is specified in the default 30 kHz RBW , at a center frequency of 2 GHz. d. The relative accuracy is a […]
-
Страница 128
128 Chapter 9 W -CDMA Measurement Application Amplitude Description Specifications Supplemental Information Spurious Emissions T able-driven spurious signals; search across regions Dynamic Range, rel ativ e 93.1 dB 98.4 dB (typical) Sensitivity , absolute − 79.4 dBm − 85.4 dBm (typical) Accuracy Attenuation = 10 dB Frequency Range 9 kHz to 3.6 […]
-
Страница 129
Chapter 9 129 W -CDMA Measurement Application Amplitude Description Specifications Supplemental Information Code Domain BTS Measurements − 25 dBm ≤ ML a ≤ − 15 dBm 20 to 30 °C a. ML (mixer level) is RF input power minus att enuation. RF input power and attenuation are set to meet the Mixer Level range. Code domain power Absolute accuracy ?[…]
-
Страница 130
130 Chapter 9 W -CDMA Measurement Application Amplitude Description Specifications Supplement al Information QPSK EVM − 25 dBm ≤ ML a ≤ − 15 dBm 20 to 30 °C a. ML (mixer level) is RF input power minus att enuation. RF input power and attenuation are set to meet the Mixer Level range. EVM Range 0 to 25% Floor 1.6% Accuracy b b. The accuracy[…]
-
Страница 131
Chapter 9 131 W -CDMA Measurement Application Amplitude Description Specifications Supplemental Information Modulation Accura cy (Composite EVM) BTS Measurements − 25 dBm ≤ ML a ≤ − 15 dBm 20 to 30 °C a. ML (mixer level) is RF input power minus att enuation. RF input power and attenuation are set to meet the Mixer Level range. Composite EV[…]
-
Страница 132
132 Chapter 9 W -CDMA Measurement Application Amplitude d. If 16 QAM and 64 QAM codes ar e included, it is not applicable. e. This specifies a synchronization rang e with CPICH for CPICH only sig nal. f. tfa = transmitter frequency × frequency reference accuracy g. The accuracy specification applies when the measured signal is the combin ation of […]
-
Страница 133
Chapter 9 133 W -CDMA Measurement Application Freque ncy Fr equency Description Specifications Supplemental Information In-Band Frequency Range Operating Band UL Frequencies UE transmit, Node B receive DL Frequencies UE receive, Node B transmit I 1920 − 1980 MHz 21 10 − 2170 MHz II 1 850 − 1910 MHz 1930 − 1990 MHz III 1710 − 178 5 MHz 180[…]
-
Страница 134
134 Chapter 9 W -CDMA Measurement Application Frequen cy[…]
-
Страница 135
135 10 GSM/EDGE Measur ement Application This chapter contains specifications for the N9071A GSM/EDGE Measurement Application. For EDGE Evolution (EGPRS2) including Normal Burst (16 QAM/32QAM) and High Symbol Rate (HSR) Burst, Option 3FP is required . Additional Definitions and Requirement s Because digital communications si gnals are noise-like, a[…]
-
Страница 136
136 Chapter 10 GSM/EDGE Measurem ent Application Measurements Measurements Description Specifications Supplemental Information EDGE Error V ector Magnitude (EVM) 3 π /8 shifted 8PSK modulation, 3 π /4 shifted QPSK, π /4 shifted 16QAM, – π /4 shifted 32QA M modulation in NSR /HSR with pulse shaping filter . Specifications based on 200 bursts C[…]
-
Страница 137
Chapter 10 137 GSM/EDGE Measurement Application Measurements e. The accuracy specification applies wh en the Burst Sync is set to Trai ning Sequence, and T rigger is set to External T rigger . Description Specifications Supplemental Information Power vs. Time and EDGE Power vs. Ti me GMSK modu lation (GSM) 3 π /8 shifted 8PSK mo dulation, 3 π /4 […]
-
Страница 138
138 Chapter 10 GSM/EDGE Measurem ent Application Measurements Description Specifications Supplemental Information Phase and Frequency Err or GMSK modulation (GSM) Specifications based on 3GPP essential conformance requirements, and 200 bursts Carrier power range at RF Input + 27 to − 45 dBm (nominal) Phase error a , rms a. Phase error and frequen[…]
-
Страница 139
Chapter 10 139 GSM/EDGE Measurement Application Measurements Description Specifications Supplemental Information Output RF Spectrum (ORFS) and EDGE Output RF Spectrum GMSK modulation (GSM) 3 π /8 shifted 8PSK modulation, 3 π /4 shifted QPSK, π /4 shifted 16QAM, – π /4 shifted 32QAM modulation in NSR/HSR (EDGE) Minimum carrier po wer at RF Inp[…]
-
Страница 140
140 Chapter 10 GSM/EDGE Measurem ent Application Measurements Description Specifications Supplemental Information ORFS and EDGE ORFS (contin ued) Dynamic Range, Spectrum due to modulation a a. Maximum dynamic range requires RF i nput power above − 2 dBm for offsets of 1.2 MHz and below fo r GSM, and above − 5 dBm for EDGE. For offsets of 1.8 MH[…]
-
Страница 141
Chapter 10 141 GSM/EDGE Measurement Application Measurements b. ORFS standards call for the use of a 5-pole, sync-tun ed filter; this and t he fo llowing footnotes review the instrument’s conformance to that standard. Of fs et frequencies can be measured by using either the FFT method or the direct time method. By default, the FFT metho d is u[…]
-
Страница 142
142 Chapter 10 GSM/EDGE Measurem ent Application Frequency Ranges Fr equency Ranges Description Uplink Downlink Supplemental Information In-Band Fr equency Ranges P-GSM 900 89 0 to 915 MHz 935 to 960 MHz E-GSM 900 880 to 915 MHz 925 to 960 MHz R-GSM 900 876 to 915 MHz 921 to 960 MHz DCS1800 17 10 to 1785 MHz 1805 to 1880 MHz PCS1900 1850 to 1910 MH[…]
-
Страница 143
143 11 Analog Demodulation Measur ement Application This chapter contains specifications for the N906 3A Analog Demodulati on Measu rement Applic ation.[…]
-
Страница 144
144 Chapter 1 1 Analog Demodulation Measurement Ap plication Analog Demodulation Perf ormance – Pre-Demodulation Analog Demodulation Performance – Pr e-Demodulation Description Specifications Supplemental Informat ion Maximum Safe Input Level A verage T o tal Power + 30 dBm (1 W) Peak Pulse Power < 10 μ s pulse width, < 1 % duty cycle, I[…]
-
Страница 145
Chapter 1 1 145 Analog Demodu l ation M easurement Application Analog Demodula tion Perfor mance – Post-Demodulation Analog Demodulation Performance – Post-Demodulation Description Specifications Supplemental Informatio n Maximum Audio Frequency Span 4 MHz Filters Low Pass High Pass Band Pass Deemphasis 300 Hz, 3 kHz, 15 kHz, 30 kHz, 80 kHz, 30[…]
-
Страница 146
146 Chapter 1 1 Analog Demodulation Measurement Ap plication Frequency Modulatio n — Level and Carrier Metrics Fr equency Modulation — Level and Carrier Metrics Description Specifications Supplemental Information FM Deviation Accuracy Rate: 1 kHz — 1 MH z, Deviation: 1 — 100 kHz a a. For optimum measu rement of rate and deviation, ensure that the c[…]
-
Страница 147
Chapter 1 1 147 Analog Demodu l ation M easurement Application Frequency Modulation — Distortion Fr equency Modulation — Distortion Description Specifications Supplemental Information Residual Rate: 1 — 10 kHz, Deviation: 5 kHz THD Distortion SINAD 0.2% (nominal) 3% (nominal) 32 dB (nominal) Absolute Accuracy Rate: 1 — 10 kHz, Deviation: 5 kHz THD […]
-
Страница 148
148 Chapter 1 1 Analog Demodulation Measurement Ap plication Frequency Modulation — Distort ion Measurement Range Rate: 1 — 10 kHz, Deviation: 5 kHz THD Distortion SINA D residual to 100 % (nominal) Measured 2nd and 3rd harmonics Measurement includes at most 10 harmonics residual to 100 % (nominal) 0 dB to residual (nominal) Description Specificati[…]
-
Страница 149
Chapter 1 1 149 Analog Demodu l ation M easurement Application Amplitude Modulation — Level and Carrier Metrics Amplitude Modulation — Level and Carrier Metrics Description Specifications Supplemental Inform ation AM Depth Accuracy Rate: 1 kHz — 1 MHz ± 0.2 % + 0.002 × measured value (nominal) AM Rate Accuracy Rate: 1 kHz — 1 MHz ± 0.05 Hz (nomi[…]
-
Страница 150
150 Chapter 1 1 Analog Demodulation Measurement Ap plication Amplitude Modulation — Distortion Amplitude Modulation — Distortion Description Specifications Supplemental Informat ion Residual Depth: 50 % Rate: 1 — 10 kHz THD Distortion SINA D 0.16 % (nominal) 0.3 % (nominal) 50 dB (nominal) Absolute Accuracy Depth: 50 % Rate: 1 — 10 kHz THD Distorti[…]
-
Страница 151
Chapter 1 1 151 Analog Demodu l ation M easurement Application Phase Modulation — Level and Carrier Metrics Phase Modulation — Level and Carrier Metrics Description Specifications Supplemental Informat ion PM Deviation Accuracy Rate: 1 — 20 kHz Deviation: 0.2 t o 6 rad ± 100 % × (0.005 + (rate/1 MHz) ) (nominal) PM Rate Accuracy Rate: 1 — 10 kHz […]
-
Страница 152
152 Chapter 1 1 Analog Demodulation Measurement Ap plication Phase Modulation — Distortion Phase Modulation — Distortion Description Specifi cations Supplemental Information Residual Rate: 1 — 10 kHz, Deviation: 628 mrad THD Distortion SINA D 0.1 % (nominal) 0.8 % (nominal) 42 dB (nominal) Absolute Accuracy THD Distortion SINA D Rate: 1 — 10 kHz, D[…]
-
Страница 153
153 12 Noise Figur e Measur ement Application This chapter contains specifications for the N9069A Noise Figure M easurement Application.[…]
-
Страница 154
154 Chapter 12 Noise Figure Measurement Application General Specifications General Specifications Description Specifications Supplemental Information Noise Figure Uncertainty Calculator a a. The figures given in the table are for the uncertainty added by the X-Se ries Signal Anal yzer instrument only . T o compute the total uncertainty for your noi[…]
-
Страница 155
Chapter 12 155 Noise Figure Measurement Application General Specifications e. Noise figure measurements can be made in this ra nge but will often be poor because of the lack of availability of built-in pream plification. For high gain DUT s or with the use of an external preamplifier , this problem can be overcome. In such cases, the In strument Un[…]
-
Страница 156
156 Chapter 12 Noise Figure Measurement Application General Specifications Description Specifications Supplemental Information Gain Instrumen t Un cer tainty a a. “Instrument Uncertain ty” is defined for gain measurements as uncertainty due to relative amplitude uncertainties encountered in the analyzer when making the m easurements required fo[…]
-
Страница 157
Chapter 12 157 Noise Figure Measurement Application General Specifications Description Specifications Supplemental Information Noise Figure Uncertainty Calculator a a. The Noise Figure Uncertainty Calculator requires the parameters shown in order to calculate the total uncertainty of a Nois e Figure measurement. Instrument Noise Fig ure Un certaint[…]
-
Страница 158
158 Chapter 12 Noise Figure Measurement Application General Specifications Nominal Instru ment Noise Figure[…]
-
Страница 159
Chapter 12 159 Noise Figure Measurement Application General Specifications Nominal Instrument Input VSWR, DC Coupled[…]
-
Страница 160
160 Chapter 12 Noise Figure Measurement Application General Specifications[…]
-
Страница 161
161 13 cdma2000 Measur ement Application This chapter contains specifications for the X-Se ries Signal Analyzer N9072A, cdma2000 measurement application. Additional Definitions and Requir ements Because digital communications si gnals are noise-like, all measurem ents will have variations. The specifications apply only with adequate averaging to re[…]
-
Страница 162
162 Chapter 13 cdma2000 Measurement Application Measurements Measurements Description Specifications Supplemental Information Channel Power 1.23 MHz Integration BW Minimum power at RF input − 50 dBm (nom inal) Absolute power accuracy a 20 to 30 ° C Atten = 10 dB 95 % Confidence Absolute power accuracy 20 to 30 ° C Atten = 10 dB a. Absolute powe[…]
-
Страница 163
Chapter 13 163 cdma2000 Measurem ent Application Measurements Description Specifications Supplemental Information Adjacent Channel Power a a. ACP test items compliance the limits of conducted spurious emission specification defined in 3GPP2 standards Minimum power at RF input − 36 dBm (nominal) Dynamic range Referenced to average power of carrier[…]
-
Страница 164
164 Chapter 13 cdma2000 Measurement Application Measurements a. The Complementary Cumu lative Distribution Function (CCDF) i s a reformatting of a hist ogram of the power envelope. The width of the amplitude bins used by the histo gram is the histogram resolution. The resolution of the CCDF will be the same as the width of those bins. Description S[…]
-
Страница 165
Chapter 13 165 cdma2000 Measurem ent Application Measurements Description Specifications Supplemental Information Spectrum Emission Mask a a. SEM test items compliance the limits of conduct ed spurious emission specification defi ned in 3GPP2 standards Dynamic Range, rela tiv e 750 kHz o ffset 73.6 dB 81.0 dB (typical) 1980 kHz offset 78.3 dB 83.9 […]
-
Страница 166
166 Chapter 13 cdma2000 Measurement Application Measurements Description Specifications Supplemental Information Code Domain BTS Measurements − 25 dBm ≤ ML a ≤ − 15 dBm 20 to 30 ° C a. ML (mixer level) is RF input power minus att enuation RF input power ra nge is accordingly determined to m eet Mixer level. Code domain power Relative power[…]
-
Страница 167
Chapter 13 167 cdma2000 Measurem ent Application Measurements Description Specifications Supplemental Information QPSK EVM − 25 dBm ≤ ML a ≤ − 15 dBm 20 to 30 ° C a. ML (mixer level) is RF input power minus att enuation RF input power range is accordingly determined to meet Mixer level . EVM Range 0 to 25 % Floor 1.6 % Accuracy b b. The ac[…]
-
Страница 168
168 Chapter 13 cdma2000 Measurement Application Measurements Description Specifications Supplemental Informat ion Modulation Accura cy (Composite Rho) BTS Measurements − 25 dBm ≤ ML a ≤ − 15 dBm 20 to 30 ° C a. ML (mixer level) is RF input power minus att enuation RF input power range is according ly determined to meet Mixer level. Specifi[…]
-
Страница 169
Chapter 13 169 cdma2000 Measurem ent Application Measurements Description Specifications Supplemental Information Pilot time offset Range − 13.33 to +13.33 ms From even second signal to start of PN sequence Accuracy ± 300 ns Resolution 10 ns Code domain timing Range ± 200 ns Pilot to cod e channel time tole ra nce Accuracy ± 1. 25 ns Resolutio[…]
-
Страница 170
170 Chapter 13 cdma2000 Measurement Application Frequency Range Fr equency Range Description Specifica tions Supplemental Information In-Band Fr equency Range Band Class 0 (North American Cellular) 869 to 89 4 MHz 824 to 849 MHz Band Class 1 (North American PCS) 1930 to 1990 MHz 1850 to 1910 MHz Band Class 2 (T ACS) 917 to 960 MHz 872 to 915 MHz Ba[…]
-
Страница 171
171 14 1xEV -DO Measur ement Application This chapter contains specifications for the X- Series, N9076A, 1xEV -DO measurement application. Additional Definitions and Requir ements Because digital communications si gnals are noise-like, all measurem ents will have variations. The specifications apply only with adequate averaging to rem ove those var[…]
-
Страница 172
172 Chapter 14 1xEV -DO Measurement Application Measurements Measurements Description Specifications Supplemental Information Channel Power 1.23 MH z Integration BW Input signal m ust not be bursted Minimum power at RF input − 50 dBm (nominal) Absolute power accuracy a 20 to 30 ° C a. Absolute power accuracy includes all error sources for in-ban[…]
-
Страница 173
Chapter 14 173 1xEV -DO Measurement Application Measurements Description Specifications Supplemental Information Power S tatistics CCDF Minimum power at RF Input − 40 dBm (no minal) Histogram Resolution 0.01 dB a a. The Complementary Cumulative Dist ribution Function (CCDF) is a reformattin g of a histogram of the power envelope. The width of the[…]
-
Страница 174
174 Chapter 14 1xEV -DO Measurement Application Measurements Description Specifications Supplemental Information Spectrum Emission Mask and Adjacent Channel Power Minimum power at RF Input − 20 dBm (nominal) Dynamic Range, rel a tiv e a a. The dynamic range specification is the ratio of the channel power to the po wer in the offset specified. The[…]
-
Страница 175
Chapter 14 175 1xEV -DO Measurement Application Measurements Description Specifications Supplemental Informat ion Spurious Emissions Dynamic Range, relative 91.9 dB 97.1 dB (typical) Sensitivity , absolute − 79.4 dBm − 85.4 dB m (typical) Accuracy , absolute 20 Hz t o 3.6 GHz ± 0.38 dB (95% confidence) 3.5 GHz to 8.4 GHz ± 1.22 dB (95% confid[…]
-
Страница 176
176 Chapter 14 1xEV -DO Measurement Application Measurements Description Specifications Supplemental I nformation Code Domain BTS Measurements − 25 dBm ≤ ML a ≤ − 15 dBm 20 to 30 °C a. ML (mixer level) is RF input power minus att enuation. For pilot, 2 MAC channels, and 16 channels of QPSK data. Absolute power accuracy ± 0.15 dB[…]
-
Страница 177
Chapter 14 177 1xEV -DO Measurement Application Measurements Description Specifications Supplemental Informatio n Modulation Accuracy (Composite Rho) − 25 dBm ≤ ML a ≤ − 15 dBm 20 to 30 °C a. ML (mixer level) is RF input power minus att enuation. For pilot, 2 MAC ch annels, and 16 channels of QPSK data Composite EVM Operating Range 0 to 25[…]
-
Страница 178
178 Chapter 14 1xEV -DO Measurement Application Frequency Range Fr equency Range Description Specifications Supplemental Information In-Band Fr equency Range (Access Network Only) Band Class 0 869 to 894 MHz North American and Korean Cellular Bands Band Class 1 1930 to 1990 MHz North American PCS Band Band Class 2 917 to 960 MHz T ACS Band Band Cla[…]
-
Страница 179
179 15 TD-SCDMA Measur ement Application This chapter contains specifications for the X-Series Signal Analyzer N9079A, TD-SCDMA measurement application. It co ntains both N9079A-1FP TD-SCDMA and N9079A-2FP HSP A/8PSK measurement application. Additional Definitions and Requir ements Because digital communications si gnals are noise-like, all measure[…]
-
Страница 180
180 Chapter 15 TD-SCDMA Measurement Application Measurements Measurements Description Specification Supplemental Inf ormation Power vs. Time Burst T ype T raf fic, UpP TS and DwP TS T ransmit power Min, Max, Mean Dynamic range 1 14.3 dB A veraging type Off, RMS, Log Measurement ti me Up to 9 slots T rigger type External1, External2, RF Burst Descri[…]
-
Страница 181
Chapter 15 181 TD-SCDMA Measurem ent Application Measurements Description Specification Supplemental Information Adjacent Channel Power Single Carrier Minimum Power at RF Input − 36 dBm (nominal) ACPR Accuracy a a. The accuracy of the Adjacent Channel Power Ratio will depend on the m ixer drive level and whether the distortion p roducts from the […]
-
Страница 182
182 Chapter 15 TD-SCDMA Measurement Application Measurements Description Specification Supplemental Inf ormation Power S tatistics CCDF Histogram Resolution 0.01 dB a a. The Complementary Cumulative Distribu tion Function (CCDF) is a reformatt ing of the histo gram of the power envelope. The width of th e amplitude bins used by the histogram is the[…]
-
Страница 183
Chapter 15 183 TD-SCDMA Measurem ent Application Measurements Description Specification Supplemental Inf ormation Spectrum Emission Mask Dynamic Range, rel a tiv e 815 kHz offs et ab a. The dynamic range specification is the ratio of the channel pow er to the power in the offset specified. The dynamic range depends on the measurement settings, such[…]
-
Страница 184
184 Chapter 15 TD-SCDMA Measurement Application Measurements Description Specification Supplemental Inf ormation Spurious Emissions Dynamic Range, rela tiv e 91.9 dB 97.1 dB (typical) Sensitivity , absolute − 79.4 dBm − 85.4 dBm (typical) Accuracy Attenuation = 10 dB Frequency Range 9 kHz to 3.6 GHz ± 0.38 dB ( 95 % confidence) 3.5 GHz to 7.0 […]
-
Страница 185
Chapter 15 185 TD-SCDMA Measurem ent Application Measurements Description Specification Supplemental Inf ormation Code Domain BTS Measurements − 25 dBm ≤ ML a ≤ − 15 dBm 20 to 30 ° C RF input power range is accordingly determined to meet Mixer level. Code Domain Power Absolute Accuracy − 10 dBc DPCH (Atten = 10 dB) b ± 0. 32 dB (9 5 % c[…]
-
Страница 186
186 Chapter 15 TD-SCDMA Measurement Application Measurements − 20 to − 30 dBc ± 0.32 dB Symbol error vector magnitude Accuracy DPCH Channel 0 to − 25 d Bc ± 1.1 % (nominal) HS-PDSCH Channel 0 to − 25 d Bc ± 1.2 % (nominal) a. ML (mixer level) is RF input power minus att enuation. b. Code Domain Power Absolute accuracy is calculated as su[…]
-
Страница 187
Chapter 15 187 TD-SCDMA Measurem ent Application Measurements Description Specification Supplemental Inf ormation Modulation Accura cy (Composite EVM) BTS Measurements − 25 dBm ≤ ML a ≤ − 15 dBm 20 to 30 ° C RF input power range is accordingly determined to meet Mixer level. Composite EVM Range T est signal with TS0 active and one DPCH in […]
-
Страница 188
188 Chapter 15 TD-SCDMA Measurement Application Measurements T est signal with TS0 active and one HS-PDSCH in TS0 ± 6 Hz + tfa (nominal) a. ML (mixer level) is RF input power minus att enuation. b. The EVM floor is derived fo r signal power − 20 dBm. The signal has on ly 1 DPCH or HS-PDSCH in TS0. c. The accuracy specification applies when the E[…]
-
Страница 189
Chapter 15 189 TD-SCDMA Measurem ent Application Frequency Range Fr equency Range Description Specification Supplemental Information In-Band Fr equency Range O p erat ing Band F requencies I 1900 to 192 0 MHz 2010 to 2025 MHz II 185 0 to 1910 MHz 1930 to 1990 MHz III 1910 to 1930 MHz[…]
-
Страница 190
190 Chapter 15 TD-SCDMA Measurement Application Frequency Range[…]
-
Страница 191
191 16 L TE Measur ement Application This chapter contains specifications for the N908 0A L TE measurement application and Preliminary specifications for the N9082A measurement applic ations. The only difference between these two applications is the Power vs. T ime measurement is included in th e N9082A and not in the N9080A. Additional Definitions[…]
-
Страница 192
192 Chapter 16 L TE Measurement Application Supported Air In terface Featur es Supported Air Interface Features Description Specific ations Supplement al Information 3GPP S tandards Sup ported 36.21 1 V8.6.0 (2009-03) 36.212 V8.6 .0 (2009-03) 36.213 V8.6 .0 (2009-03) 36.101 V8.5 .1 (2009-03) 36.104 V8.5 .0 (2009-03) 36.141 V8.2 .0 (2009-03) 36.521-[…]
-
Страница 193
Chapter 16 193 L TE Measurement Application Measurements Measurements Description Specifica tions Supplement al Information Channel Power Minimum power at RF input − 50 dBm (nom inal) Absolute power accuracy a 20 to 30 ° C Atten = 10 dB a. Absolute power accuracy includes all error sources for in-band signals except mismatch errors and repeatabi[…]
-
Страница 194
194 Chapter 16 L TE Measurement Application Measurements Description Spec ifications Supplement al Information Adjacent Channel Power Single Channel Minimum power at RF input − 50 dBm (nominal) Accuracy Channel Bandwidth Radio Offset 5 MHz 10 MHz 20 MHz ACPR Range for Spec ification MS Adjacent a ± 0.15 dB ± 0.21 dB ± 0.36 dB − 33 to − 27 […]
-
Страница 195
Chapter 16 195 L TE Measurement Application Measurements Description Sp ecification Supplement al Inform ation Occupied Bandwidth Minimum carrier power at RF Input − 30 dBm (nominal) Frequency accura cy ±10 kHz RBW = 30 kHz, Number of Points = 1001, Span = 10 MHz Description Spec ifications Supplement al Information Spectrum Emission Mask Offset[…]
-
Страница 196
196 Chapter 16 L TE Measurement Application Modulation Analysis Specifications Modulation Analysis Specifications Description Specifica tions Supplement al Information EVM Input Range 0 dBm, signal level within one range step of overload Residual EVM Floor a for Downlink (OFDMA) a. Overall EVM and Data EVM using 3GPP standard-d efined calculation. […]
-
Страница 197
Chapter 16 197 L TE Measurement Application In-Band Frequ ency Range In-Band Frequency Range Operating Band, FDD Uplink Downlink 1 1920 to 1980 MHz 211 0 to 2170 MHz 2 1850 to 1910 MHz 1930 to 1990 MHz 3 1710 to 1785 MHz 1805 to 1880 MHz 4 1710 to 1755 MHz 211 0 to 2155 MHz 5 824 to 849 MHz 869 to 894 MHz 6 830 to 840 MHz 875 to 885 MHz 7 2500 to 2[…]
-
Страница 198
198 Chapter 16 L TE Measurement Application In-Band Fr equency Range[…]
-
Страница 199
199 17 Single Acquisition Combined Fixed W iMAX Measur ement Application This chapter contains specificatio ns for the EXA S ignal Analyzer N9074A , Combined Fixed W iMAX measurement application. Additional Definitions and Requirement s Because digital communications si gnals are noise-like, all measurem ents will have variations. The specification[…]
-
Страница 200
200 Chapter 17 Single Acquisition Combined Fixed WiMAX Measurement Application N9074A-XFP , Single Acquisition Co mbined Fixed WiMAX Measurements N9074A-XFP , Single Acquisition Combined Fixed W iMAX Measur ements Description Specifications Supplemental Informatio n T ransmit Power Input signal must not be burst ed 10 MHz Integration BW Minimum pow[…]
-
Страница 201
Chapter 17 201 Single Acquisition Combined Fi xed WiMAX Measurement Application N9074A-XFP , Singl e Acquisition Combined Fi xed WiMAX Measur ements d. The relative accuracy is a measure of the ratio of the power at the of fs et to the main channel power . It applies for spectrum emission levels in the offsets that are well above the dynamic range […]
-
Страница 202
202 Chapter 17 Single Acquisition Combined Fixed WiMAX Measurement Application N9074A-XFP , Single Acquisition Co mbined Fixed WiMAX Measurements[…]
-
Страница 203
203 18 Single Acquisition Combined WLAN Measur ement Application This chapter contains specificatio ns for the EXA S ignal Analyzer N9077A , Combined WLAN measurement application. Additional Definitions and Requirement s Because digital communications si gnals are noise-like, all measurem ents will have variations. The specifications for dynamic ra[…]
-
Страница 204
204 Chapter 18 Single Acquisition Combined WL AN Measurement Application N9077A, Combined WLAN 802.1 1a or 802.1 1g-OF DM Measurements N9077A, Combined WLAN 802.1 1a or 802.1 1g-OFDM Measurements Description Specifications Supplemental Informatio n T ransmit Power Input signal must not be burst ed 18 MHz Integration BW Minimum power at RF Input –[…]
-
Страница 205
Chapter 18 205 Single Acquisition Combined WL AN Measurement Application N9077A, Combined WLAN 802.1 1 a or 802.1 1g-OFDM Measurements Absolute 20 – 30°C ±1.58 dB 30 MHz offset Dynamic Range, rela tiv e 67.5 dB (nominal) Sensitivity , absol ute –80.7 dBm (nominal) Accuracy Relative ±0.66 dB Absolute 20 – 30°C ±1.60 dB a. The dynamic rang[…]
-
Страница 206
206 Chapter 18 Single Acquisition Combined WL AN Measurement Application N9077A, Combined WLAN 802.1 1a or 802.1 1g-OF DM Measurements Center Frequency Leakage UUT Maximum Leakage –10 dBc (nominal) Analyzer Noise Floor –45 dBc (nominal) Frequency Range ±100 kHz (nomin al) Accuracy ±10 Hz+tfa c a. ML (mixer level) is RF input po wer mi nus att[…]
-
Страница 207
Chapter 18 207 Single Acquisition Combined WL AN Measurement Application N9077A, Combined WLAN 802.1 1b or 802.1 1g-DSSS Measurements N9077A, Combined WLAN 802.1 1b or 802.1 1g-DSSS Measurements Description Specifications Supplemental Informatio n T ransmit Power Input signal must not be burst ed 22 MHz Integration BW Minimum power at RF Input –5[…]
-
Страница 208
208 Chapter 18 Single Acquisition Combined WL AN Measurement Application N9077A, Combined WLAN 802.1 1b or 802.1 1g-DSSS Measurements Absolute 20 – 30°C ±1.59 dB 33 MHz offset Dynamic Range, rel a tiv e f 68.3 dB (nominal) Sensitivity , absol ute –80.7 dBm (nominal) Accuracy Relative ±0.68 dB Absolute 20 – 30°C ±1.60 dB a. The dynamic ra[…]
-
Страница 209
Chapter 18 209 Single Acquisition Combined WL AN Measurement Application N9077A, Combined WLAN 802.1 1b or 802.1 1g-DSSS Measurements Currier Suppression UUT Maximum Suppression –10 dBc (nominal) Analyzer Noise Floor –46 dBc (nominal) Frequency Range ±100 kHz (nomin al) Accuracy ±10 Hz+tfa c a. ML (mixer level) is RF input po wer m inus atten[…]
-
Страница 210
210 Chapter 18 Single Acquisition Combined WL AN Measurement Application N9077A, Combined WLAN 802.1 1b or 802.1 1g-DSSS Measurements[…]
-
Страница 211
21 1 19 iDEN/W iDEN/MotoT alk Measur ement Application This chapter contains specifications for the N6149A , iDEN/W iDEN/MotoT alk Measurement Application. Additional Definitions and Requirement s Because digital communications si gnals are noise-like, all measurem ents will have variations. The specifications apply only with adequate averaging to […]
-
Страница 212
212 Chapter 19 iDEN/W iDEN/MotoT alk Measurement Application Freq uen cy and Ti me Fr equency and T ime Description Specifications Supplemental Informat ion Frequency and T ime-related Specifications Please refer to “Frequency and T ime” on page 15[…]
-
Страница 213
Chapter 19 213 iDEN/W iDEN/MotoT alk M easurement Application Amplitude Accuracy and Range Amplitude Accuracy and Range Dynamic Range Description Specifications Supplemental Informatio n Amplitude an d Range-relat ed Specifications Please refer to “Amplitude Accuracy and Range” on page 29 . Description Specifications Supplemental Information Dy[…]
-
Страница 214
214 Chapter 19 iDEN/W iDEN/MotoT alk Measurement Application Application Specifications Application Specifications Description Specifications Supplemental Information Measurements iDEN Power ACP (adjace nt channel power) Occupied Bandwidth Includes Carrier Power on summary data screen iDEN Demod PvT (power versus time) Modulation analysis BER (bit […]
-
Страница 215
Chapter 19 215 iDEN/W iDEN/MotoT alk M easurement Application Applicat ion Sp ecifications Description Specifications Supplemental Information iDEN Power Supported Formats iDEN single carrier TDMA W iDEN- multiple carrier TDMA Pass/Fail T ests Occupied Bandwidth (OB W) Adjacent Channel Power (ACP) Carrier Configuration 25 kH z W iDEN 50 kHz WiDEN 7[…]
-
Страница 216
216 Chapter 19 iDEN/W iDEN/MotoT alk Measurement Application Application Specifications Composite EVM Floor a 1.4% (no minal) Measurement Parameters Search Length Normalize IQ and FSK waveforms Measurement Parameters (advanced) Gaussian BT Symbol Rate Burst Search on/of f Bandwidth Time product Result Displays Slot Error V ector T ime Slot Error Su[…]
-
Страница 217
217 20 DVB-T/H Measur ement Application This chapter contains specificatio ns for the EXA S ignal Analyzer N6153A , DVB-T/H measurement application. Additional Definitions and Requirement s Because digital communications si gnals are noise-like, all measurem ents will have variations. The specifications apply only with adequate averaging to rem ove[…]
-
Страница 218
218 Chapter 20 DVB-T/H Measurement Application N6153A, DVB-T/H Measurements Application N6153A, DVB-T/H Measurements Application Description Specifications Supplemental Informatio n Channel Power Input signal must not be burst ed 7.61 MHz Integration BW Minimum power at RF Input –50 dBm (nominal) Absolute Power Accuracy a 20 to 30 °C a. Absolute[…]
-
Страница 219
Chapter 20 219 DVB-T/H Measurement Application N6153A, DVB-T/H Me asur ements Applic at ion a. The Complementary Cum ulative Distribution Func tion (CCDF) is a reformattin g of a histogram of the power envelope. The width of the amplitude bin s used by the histo gram is the histo gram resolution. The resolution of the CCDF will be the same as the w[…]
-
Страница 220
220 Chapter 20 DVB-T/H Measurement Application N6153A, DVB-T/H Measurements Application Sensitivity , absol ute –105.5 dBm – 1 1 1.5 dBm (typical) Accuracy Relative ±0.63 dB Absolute 20 – 30°C ±1.05 dB a. The dynamic range specification is the r atio of the ch annel power to the power in the of fset specified. The dynamic range depends on […]
-
Страница 221
Chapter 20 221 DVB-T/H Measurement Application N6153A, DVB-T/H Me asur ements Applic at ion Description Specifications Supplemental Information 64 QAM EVM ML a = –20 dBm 20 to 30 °C FFT Size = 2048, GuardInterval = 1/32, alpha = 1 EVM Operating range 0 to 8% Floor 0.64% (blind equalizer ON) 0.73% (blind equalizer OFF) Accuracy from 0.7% to 1 .2%[…]
-
Страница 222
222 Chapter 20 DVB-T/H Measurement Application N6153A, DVB-T/H Measurements Application Accuracy ±0.50% BER Before V iterbi Range 0 to 1.0×10 –1 Resolution 0.01×10 –exp onet BER Before Reed-Solomon Range 0 to 1.0×10 –3 Resolution 0.01×10 –exp onet BER After Reed-Solomon Range 0 to inf Resolution 1 a. ML (mixer level) is RF input po wer[…]
-
Страница 223
223 21 ISDB-T Measur ement Application This chapter contains specificatio ns for the EXA S ignal Analyzer N6155A , ISDB-T measurement application. Additional Definitions and Requirement s Because digital communications si gnals are noise-like, all measurem ents will have variations. The specifications apply only with adequate averaging to rem ove t[…]
-
Страница 224
224 Chapter 21 ISDB-T Measurement Application N6155A, ISDB-T/ TSB Measurement Applicati on N6155A, ISDB-T/T SB Measurement Application Description Specifications Supplemental Informatio n Channel Power Input signal must not be burst ed 5.6 MHz Integration BW Minimum power at RF Input –50 dBm (nominal) Absolute Power Accuracy a 20 to 30 °C a. Abs[…]
-
Страница 225
Chapter 21 225 ISDB-T Measurement Application N6155A, ISDB- T/TSB Measur ement Applicatio n Description Specifications Supplemental I nformation Power S tatistics CCDF Minimum power at RF Input –50 dBm (nominal) Histogram Resolution 0.01 dB a a. The Complementary Cumulative Di stribution Function (CCDF) is a reformatting of a histogram of the pow[…]
-
Страница 226
226 Chapter 21 ISDB-T Measurement Application N6155A, ISDB-T/ TSB Measurement Applicati on Description Specifications Supplemental Information Spectrum Emission Mask Limit T ype • Manual • JEIT A (ARIB-B 31) according to P ≤ 0.025 W ; 0.025 W < P ≤ 0.25 W ; 0.25 W < P ≤ 2.5 W ; P > 2.5 W (P is the channel power) • ABNT Non-Crit[…]
-
Страница 227
Chapter 21 227 ISDB-T Measurement Application N6155A, ISDB- T/TSB Measur ement Applicatio n c. The sensitivity is specified with 0 dB input attenu ation. It represents the noise limitatio ns of the ana- lyzer . It is tested without an input signal. The sensitivity at thi s offset is specified in the default 10.0 kHz RBW , at a center frequency of 7[…]
-
Страница 228
228 Chapter 21 ISDB-T Measurement Application N6155A, ISDB-T/ TSB Measurement Applicati on Out of Band Filtering On or Off Data Equalization On or Off Description Specifications Supplemental Information Modulation Analysis Measurements I/Q Measured Polar Graph Con stellation (subcarriers 0 to 5616 configurable for 8K FFT) MER (dB), EVM (%),Mag Erro[…]
-
Страница 229
Chapter 21 229 ISDB-T Measurement Application N6155A, ISDB- T/TSB Measur ement Applicatio n Result Metrics MER (dB), EVM (%), Mag Error (%), Phase Error (deg ), R M S, Peak (Peak Position) MER (dB) and EVM (%) by Layer A, Layer B, Layer C, Data, Pilot, TMCC, AC1 Frequency Error (Hz) Quadrature Error (deg) Amplitude Imbalance (d B) Inband Spectrum R[…]
-
Страница 230
230 Chapter 21 ISDB-T Measurement Application N6155A, ISDB-T/ TSB Measurement Applicati on Description Specifications Supplemental Information ISDB-T Modulation Analysis Specification ML a = –20 dBm 20 to 30 °C Segments=13 Mode3 Guard Interval=1/8 Partial Reception=Off Layer A-C Segment=13 Code Rate=3/4 T ime Interleaving I=2 Modulation=64QAM EV[…]
-
Страница 231
Chapter 21 231 ISDB-T Measurement Application N6155A, ISDB- T/TSB Measur ement Applicatio n Amplitude Imbalance Range –1 dB to +1 dB a. ML (mixer level) is RF input po wer m inus atten uation b. The accuracy specification applies at the EVM =1%. c. tfa = transmitter frequency x frequency reference accuracy Description Specifications Supplemental […]
-
Страница 232
232 Chapter 21 ISDB-T Measurement Application N6155A, ISDB-T/ TSB Measurement Applicati on[…]
-
Страница 233
233 22 DTMB Measur ement Application This chapter contains specificatio ns for the EXA S ignal Analyzer N6156A , DTMB measurement application. Additional Definitions and Requirement s Because digital communications si gnals are noise-like, all measurem ents will have variations. The specifications apply only with adequate averaging to rem ove those[…]
-
Страница 234
234 Chapter 22 DTMB Measurement Application N6156A, DTMB Measurement Application N6156A, DTMB Measur ement Application Description Specifications Supplemental Informatio n Channel Power Input signal must not be burst ed 8 MHz Integration BW Minimum power at RF Input –50 dBm (nominal) Absolute Power Accuracy a 20 to 30 °C a. Absolute power accura[…]
-
Страница 235
Chapter 22 235 DTMB Measurement Application N6156A, DTMB Measurement Application Description Specifications Supplemental I nformation Power S tatistics CCDF Minimum power at RF Input –50 dBm (nominal) Histogram Resolution 0.01 dB a a. The Complementary Cum ulative Distribution Func tion (CCDF) is a reformattin g of a histogram of the power envelo[…]
-
Страница 236
236 Chapter 22 DTMB Measurement Application N6156A, DTMB Measurement Application Description Specifications Supplemental Information Spectrum Emission Mask 7.56 MHz Integration BW RBW = 3.9 kHz 4.2 MHz offset Dynamic Range, rel a tiv e ab a. The dynamic range specification is the r atio of the ch annel power to the power in the of fset specified. T[…]
-
Страница 237
Chapter 22 237 DTMB Measurement Application N6156A, DTMB Measurement Application Description Specifications Supplemental Information 16 QAM EVM ML a = –20 dBm 20 to 30 °C a. ML (mixer level) is RF input po wer m inus atten uation Sub-carrier Number: 3780 Code Rate: 0.8 Interleaver T ype: B=52, M=720 Frame Header: PN420 PN Phase Change: T rue EVM[…]
-
Страница 238
238 Chapter 22 DTMB Measurement Application N6156A, DTMB Measurement Application Description Specifications Supplemental Information 16 QAM EVM ML a = –20 dBm 20 to 30 °C a. ML (mixer level) is RF input po wer mi nus atten uation Sub-carrier Number: 1 Code Rate: 0.8 Interleaver T ype: B=52, M=720 Frame Header: PN595 PN Phase Change: T rue Insert[…]
-
Страница 239
239 23 CMMB Measur ement Application This chapter contains specificatio ns for the EXA S ignal Analyzer N6158A , CMMB m easurement application. Additional Definitions and Requirement s Because digital communications si gnals are noise-like, all measurem ents will have variations. The specifications apply only with adequate averaging to rem ove thos[…]
-
Страница 240
240 Chapter 23 CMMB Measurement Application N6158A, CMMB Measurements Application N6158A, CMMB Measur ements Application Description Specifications Supplemental Informatio n Channel Power Input signal must not be burst ed 8 MHz Integration BW Minimum power at RF Input –50 dBm (nominal) Absolute Power Accuracy a 20 to 30 °C a. Absolute power accu[…]
-
Страница 241
Chapter 23 241 CMMB Measurement Application N6158A, CMMB Me asur ements Applic ation Description Specifications Supplemental I nformation Power S tatistics CCDF Minimum power at RF Input –50 dBm (nominal) Histogram Resolution 0.01 dB a a. The Complementary Cum ulative Distribution Func tion (CCDF) is a reformattin g of a histogram of the power en[…]
-
Страница 242
242 Chapter 23 CMMB Measurement Application N6158A, CMMB Measurements Application Description Specifications Supplemental Information Spectrum Emission Mask 8 MHz Integration BW RBW = 3.9 kHz 4.2 MHz offset Dynamic Range, rel a tiv e ab a. The dynamic range specification is the r atio of the ch annel power to the power in the of fset specified. The[…]
-
Страница 243
Chapter 23 243 CMMB Measurement Application N6158A, CMMB Me asur ements Applic ation Description Specifications Supplemental Information Modulation Analysis Settings Device T ype Transmitter or Exciter T rigger FreeRun, External 1, External 2 or Periodic T imer • Ext ernal T rigger is used with 1 PPS input from GPS, (this trigger method is recomm[…]
-
Страница 244
244 Chapter 23 CMMB Measurement Application N6158A, CMMB Measurements Application Description Specifications Supplemental Information Modulation Analysis Measurement I/Q Measured Polar Graph Con stellation (-1 538 to 1538 subcarriers) EVM, MER, Mag Error , Phase Error RMS, Peak (Subcarrier position), Freq Error I/Q Error (Quad V iew) MER vs. Subcar[…]
-
Страница 245
Chapter 23 245 CMMB Measurement Application N6158A, CMMB Me asur ements Applic ation Channel Impulse Response Spectrum Flatness Amax-Ac (dB) (Limit +0.5) Amin-Ac (dB) (Limit -0.5) Amax: max amplitude valu e Amin: min am pl itude value Ac: center frequency amp value Result Metrics MER (dB), EVM (%), Mag Error (%), Phase Error (deg) RMS, Peak (Peak P[…]
-
Страница 246
246 Chapter 23 CMMB Measurement Application N6158A, CMMB Measurements Application EVM (Data EQ OFF) Operating range 0 to 16% Floor 0 .70% Accuracy from 0.7% to 1 .0% from 1.0% to 2 .0% from 2.0% to 1 6.0% ±0.30% ±0.30% ±0.40% MER (Data EQ OFF) Operating range ≥ 16.00 dB Floor 43.00 dB Accuracy (Data EQ OFF) from 39 to 43 dB from 34 to 39 dB fr[…]
-
Страница 247
247 24 VXA Measur ement Application This chapter contains specifications fo r the 89601X VXA Measurement Application. Additional Definitions and Requirement s Because digital communications si gnals are noise-like, all measurem ents will have variations. The specifications apply only with adequate averaging to rem ove those variations. Spec ificati[…]
-
Страница 248
248 Chapter 24 VXA Measurement Application Basic VSA-Lite Performance (89601X Opti on 205) Basic VSA-Lite Performance (89601X Option 205) Frequency Resolution Bandwidth (RBW) Description Specifications Supplemental Information Range Maximum Frequency Option 503 3.6 GHz Option 507 7 GHz Option 513 13.6 GHz Option 526 26.5 GHz Pr eamp Option P03 3.6 […]
-
Страница 249
Chapter 24 249 VXA Measurement Application Basic VSA-Lite Performance (89601X Option 205) Input Amplitude Accuracy RBW Shape Factor The window choices below allow the user to optimize the RBW shape as needed for best amplitude accuracy , best dynamic range, or best response to transient signal characteristics. Selectivity Passband Flatness Rejectio[…]
-
Страница 250
250 Chapter 24 VXA Measurement Application Basic VSA-Lite Performance (89601X Opti on 205) Fr equency Span ≤ 3.6 GHz ≤ 10 MHz ≤ 3.6 GHz > 10 MHz > 3.6 GHz ≤ 10 MHz > 3.6 GHz > 10 MHz Flatness ± 0.40 dB ± 0.45 dB Rms (nominal) 0.02 dB 0.04 dB 0.18 dB (Option B2 5) 0.25 dB 0.28 dB (Option B2 5) Sensitivity − 147 dBm/Hz 10 MHz […]
-
Страница 251
Chapter 24 251 VXA Measurement Application Basic VSA-Lite Performance (89601X Option 205) Dynamic Range Description Specifications Supplemental Informa tion Third-order intermodulation distortion − 84 dBc Tw o − 20 dBfs tones, 10 dBm input range, 400 MHz to 13.6 GHz, tone separation > 5x IF Prefilter BW Noise Density at 1 GHz Input Range Den[…]
-
Страница 252
252 Chapter 24 VXA Measurement Application Analog Modulation Analysis (89601 X Op tio n 205) Analog Modulation Analysis (89601X Option 205) Description Specifications Supplemental Information AM Demodulation Carrier ≤− 17 d Bfs Demodulator Bandwidth Same as selected measurement span Modulation Index Accuracy ± 1 % Harmonic Distortion − 55 dB[…]
-
Страница 253
Chapter 24 253 VXA Measurement Application Analog Modulatio n Analysis (89601X O ption 205) FM Demo dulation Demodulator Bandwidth Same as selected measurement span Modulation Index Accuracy ± 0.1 % of span, deviation < 2 MHz, modulation rate ≤ 500 kH z Harmonic Distortion Modulation Rate < 50 kHz ≤ 500 kHz Deviation ≤ 200 kHz ≤ 2 MH[…]
-
Страница 254
254 Chapter 24 VXA Measurement Application V ector Modulatio n Analy sis (89601X O ption A Y A) V ector Modulation Analysis (89601X Option A Y A) Description Specifications Supplement al Information Accuracy Formats other than FSK, 8/16VSB, 16/32 APSK, and OQPSK; Conditions: Fu ll scale signal, fully contained in the measur ement span, frequency &l[…]
-
Страница 255
Chapter 24 255 VXA Measurement Application V ector Modulation Analy sis (89601X O ption A Y A) Residual EVM 16, 32, 64, 128, 256, 512, or 1024 QAM ≤ 1.0 % (SNR ≥ 40 dB) Symbol rate = 6 .9 MHz, α = 0.15, frequency < 3.6 GHz, 8 MHz span, full-scale signal, range ≥− 30 dBm, result length = 800, averages = 10 a. 1.0 % rms EVM and 0.8 deg RM[…]
-
Страница 256
256 Chapter 24 VXA Measurement Application V ector Modulatio n Analy sis (89601X O ption A Y A)[…]
-
Страница 257
257 25 Option EMC Pr ecompliance Measur ements This chapter contains specifications for the option EMC precompliance measuremen ts.[…]
-
Страница 258
258 Chapter 25 Option EMC Precompliance Measurements Requirements for X-Ser ies Requir ements for X-Series • The X-Series must ha ve re v . A.02.00 or later • The X-Series must ha ve option EMC license Conditions Required to Meet Specifications • The X-Series are within their calibration cycle • The X-Series has be en at ope rating temperat[…]
-
Страница 259
Chapter 25 259 Option EMC Precompliance Measurements Freque ncy Fr equency Description Specifications Supplemental information Frequency Range CISPR band A, B, C, D, E (9 kHz to 18 GHz) and up to 26 .5 GHz EMI Resolution Bandwidths See T able 25-1 on page 260 and T able 25-2 on page 260 CISPR A vailable when the EMC S tandard is CISPR 200 Hz, 9 kHz[…]
-
Страница 260
260 Chapter 25 Option EMC Precompliance Measurements Frequen cy T able 25-1 CISPR Band Settings CISPR Band Freq uency Rang e CISPR RBW Default Data Points Band A 9 – 150 kHz 200 Hz 14 13 Band B 150 kHz – 30 MHz 9 kHz 6637 Band C 30 – 300 MHz 120 kHz 450 3 Band D 300 MHz – 1 GHz 120 kHz 1 1671 Band C/D 30 MHz – 1 GHz 120 kHz 1617 1 Band E […]
-
Страница 261
Chapter 25 261 Option EMC Precompliance Measurements Amplitude Amplitude Description Specifications Supplemental Informat ion EMI A verage Detector Used for CISPR-compliant average measurements and, with 1 MHz RBW , for frequencies above 1 GHz Default A verage T ype All filt ering is done on the linear (voltage) scale even when the display scale is[…]
-
Страница 262
262 Chapter 25 Option EMC Precompliance Measurements Amplitude[…]